![]() Figure 2 of
Yamagami, Mol Vis 2005;
11:632-640.
Figure 2 of
Yamagami, Mol Vis 2005;
11:632-640.
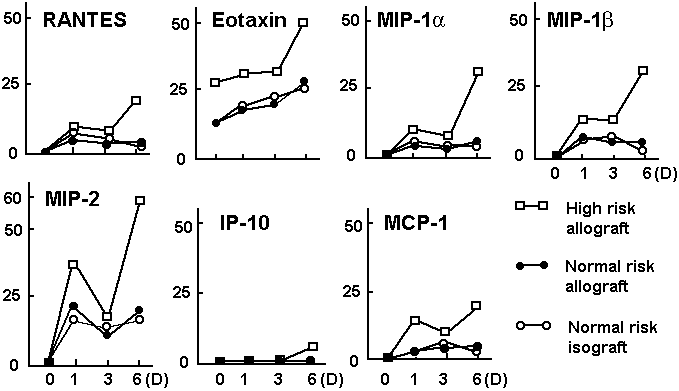
Figure 2. Densitometric analysis of chemokine mRNA species
Normalized densitometric analyses of autoradiograms (Figure 1) are shown for high-risk (HR) grafts (square) and normal-risk (NR) grafts (round). Vertical axes indicate arbitrary units which were based on densitometry and normalized to L32. The densitometric analysis shows the average density from two sets of RPA results. Two sets of results are well consistent with each other. Compared to NR transplantation, HR eyes exhibited significantly elevated mRNA levels for MIP-2 and MCP-1 by day 1, and higher levels of RANTES, MIP-1α, MIP-1β, MIP-2, and MCP-1 by day 6.
