![]() Figure 1 of
Yamagami, Mol Vis 2005;
11:632-640.
Figure 1 of
Yamagami, Mol Vis 2005;
11:632-640.
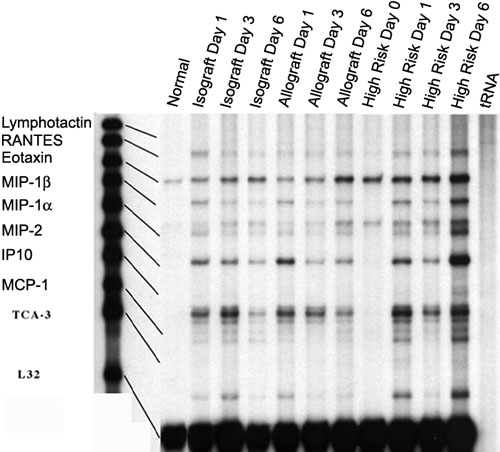
Figure 1. Chemokine gene expression during the early postoperative phase after corneal transplantation
Total RNA (20 μg) was applied to each lane to quantify the gene expression for nine chemokine species at each of 4 times (day 0 data represent nonsurgical eyes). Two sets of RPA results were obtained, and representative autoradiographic data for the panel of chemokines tested are shown. On the basis of the undigested probes' migration patterns, specific bands for each chemokine are identified as shown for ungrafted normal corneas, isografts, normal-risk allografts, and high-risk allografts at the specified times after transplantation.