![]() Figure 4 of
Zhou, Mol Vis 2005;
11:414-424.
Figure 4 of
Zhou, Mol Vis 2005;
11:414-424.
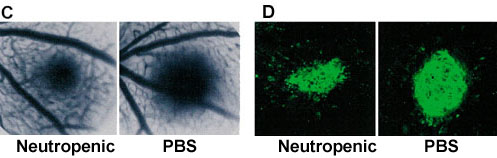
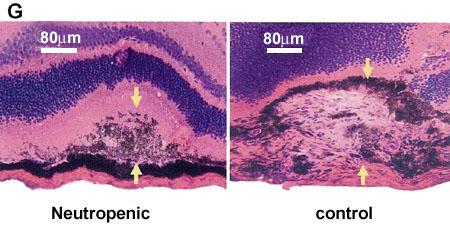
Figure 4. Inhibition of CNV formation in neutropenic mice
A: Administration of NIMP-R14 depleted neutrophils from site of laser injury. The relative quantity of infiltrating neutrophils was calculated based on the anti-Ly-6G fluorescence volume. The bars represent the mean at day 3 after laser injury; the error bars represent the standard deviation. B: Neutrophil depletion did not affect macrophage infiltration into the sites of laser injury. The relative quantity of infiltrating macrophages was calculated based on the F4/80 fluorescence volume. The bars represent the mean at day 3 after laser injury; the error bars represent the standard deviation. C: Representative late phase fluorescein angiograms of neutropenic (angiogram shown fas a FA score of 1) and control (angiogram shown fas a FA score of 2) mice. D: The topographical image representation of the CNV lesion stained by FITC-isolectin B4 of neutropenic and control mice. E: Comparison of median of CNV FA score between neutropenic and control mice. F: Comparison of mean of CNV volume between neutropenic and control mice. G: Representative histologic appearance of CNV lesion of neutropenic and control mice. Tissue sections were stained with H & E. Arrows show the thickness of CNV lesions. Experiments in C-G were done at day 7 after laser photocoagulation. There were 35 mice in the Neutropenic group, 35 mice in the PBS group, and 5 mice in the Isotype group. Statistical analyses were done using a t-test, except the Wilcoxon rank sum test was used in E.