![]() Figure 4 of
Tarnuzzer, Mol Vis 2005;
11:36-49.
Figure 4 of
Tarnuzzer, Mol Vis 2005;
11:36-49.
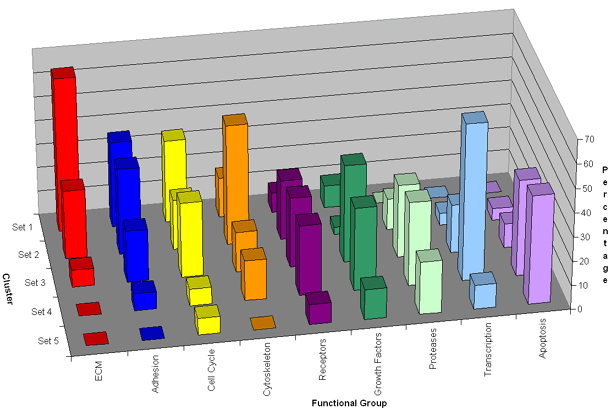
Figure 4. Distribution of expressed genes within each functional group
A bar graph representation of the percent of genes in each functional group that corresponds to each cluster is shown. Transcripts for ECM, cell adhesion, cell cycle, and cytoskeleton denoted at the left of the graph show pronounced upregulation. Transcripts for receptors and growth factors show little to no change. Transcripts for proteases, transcription and apoptosis show downregulation at the right of the graph.
