![]() Figure 3 of
Tarnuzzer, Mol Vis 2005;
11:36-49.
Figure 3 of
Tarnuzzer, Mol Vis 2005;
11:36-49.
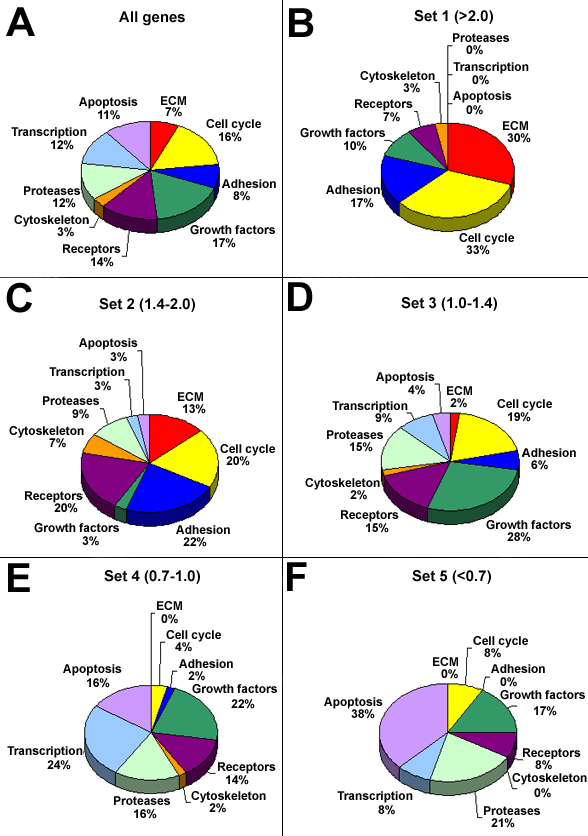
Figure 3. Cluster analysis of all genes expressed in sclera of control and aphakic eyes
Pie chart representation of the distribution by functional group of expressed genes across 5 cluster sets (K=5) expressed as percent of genes in each functional group per cluster. A: Cluster analysis utilizing K-means clustering for all 172 expressed genes. B: Genes that cluster into Set 1 with greater than 2.0 fold increase in the aphakic eye. C: Genes that cluster into Set 2 with between 1.4 and 2.0 fold increase in the aphakic eye. D: Genes that cluster into Set 3 with between 1.0 and 1.4 fold increase in the aphakic eye. E: Genes that cluster into Set 4 with between 1.0 and 0.7 fold decrease in aphakic eye. F: Genes that cluster into Set 5 with less than 0.7 fold change in the aphakic eye.
