![]() Figure 2 of
Tarnuzzer, Mol Vis 2005;
11:36-49.
Figure 2 of
Tarnuzzer, Mol Vis 2005;
11:36-49.
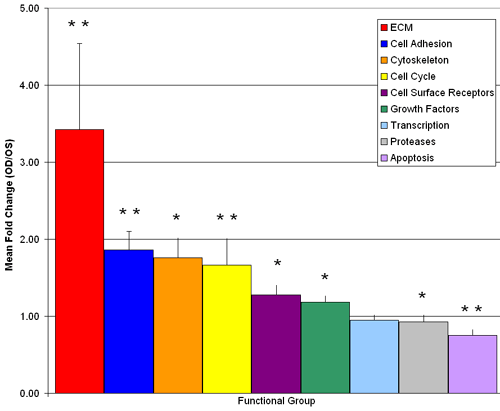
Figure 2. Average fold change in expression of scleral transcripts in aphakic versus unmanipulated eyes
Transcripts were classified into 9 functional groups and average expression changes were calculated from the three array experiments. Asterisks denote statistical significance (p<0.05) for a paired Student's t-test and double asterisks denote statistical significance with the Bonferroni correction for multiple comparisons.
