![]() Figure 1 of
Tarnuzzer, Mol Vis 2005;
11:36-49.
Figure 1 of
Tarnuzzer, Mol Vis 2005;
11:36-49.
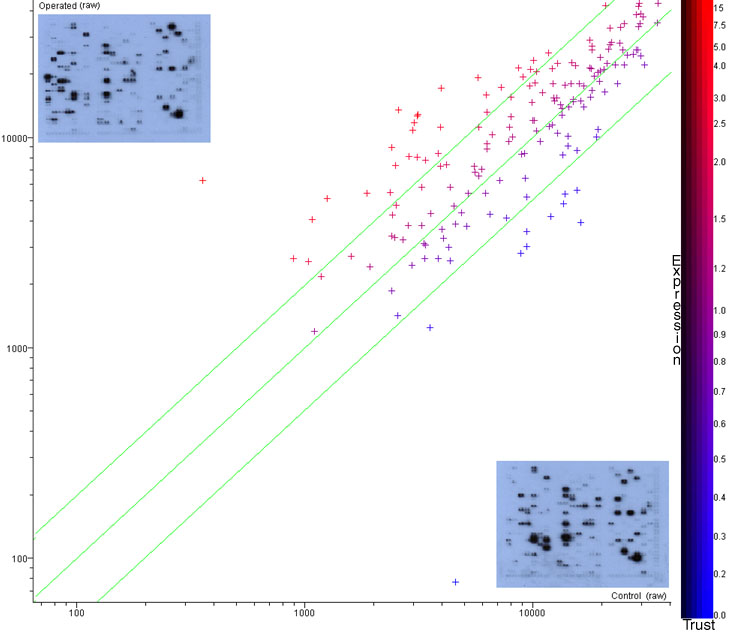
Figure 1. Scatter plot of the 172 genes expressed in sclera from aphakic versus normal monkey eyes
Graphical representation of the genes expressed in sclera from aphakic (operated) versus unmanipulated (control) eyes. Red represents upregulation and blue represents downregulation of the corresponding gene in sclera of the aphakic eye, relative to that of the unmanipulated eye and the degree of this change is represented at the right of the graph. Axes are in relative intensity units from a composite of the three arrays analyzed. The green lines are guides for comparing the relative expression of the two data sets. The center line indicates equivalent expression, the upper line marks a twofold increase, and the lower line marks a twofold decrease. Inset on each axis is a representative gene array autoradiograph.