![]() Figure 5 of
Hawse, Mol Vis 2005;
11:274-283.
Figure 5 of
Hawse, Mol Vis 2005;
11:274-283.
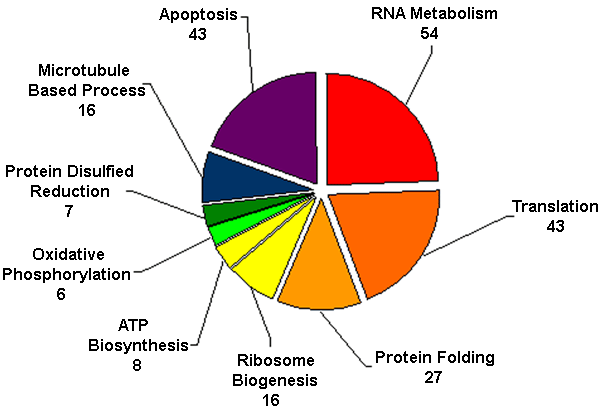
Figure 5. Cluster analysis of genes exhibiting decreased expression in lens epithelial cells
Statistical cluster analysis using the program EASE was used to subcategorize genes with significantly decreased expression in lens epithelium (compared to cortical fiber cells). The pie chart is a visual enumeration of selected (not all) functional categories. The total number of genes comprising each functional category are indicated. The size of the pie slices represent the relative number of genes with decreased expression in the selected categories. The proportions (and the respective counts) of genes in the functional category have no relevance or biological importance; they are simply presented as a broad overview of the EASE analysis. The complete list of the functional categories identified by the EASE analysis is available in Appendix 1. Not all of the genes analyzed fall into one of the functional categories presented in this figure. Also, some genes are represented in more than one functional category. Therefore the total number of genes in the figure do not match the total number of genes with decreased expression at the 2 fold or greater level.