![]() Figure 7 of
Gupta, Mol Vis 2005;
11:1018-1040.
Figure 7 of
Gupta, Mol Vis 2005;
11:1018-1040.
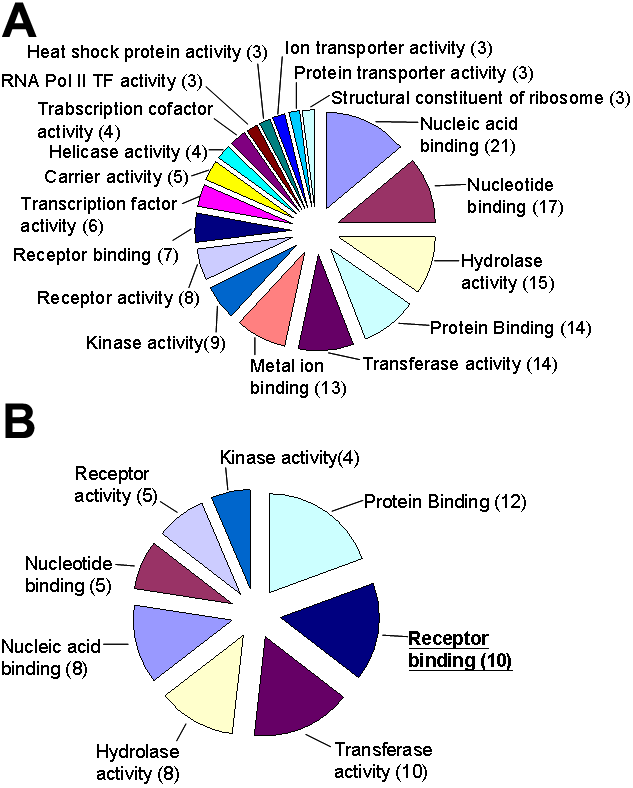
Figure 7. Cluster analysis reveals molecular functions
EASE was used to statistically cluster genes that were modulated with dexamethasone (Dex) and vehicle treatment. The total number of genes from the filtered lists in each functional category is indicated next to the pie slice which represents the relative number of genes with modulated expression in the molecular category. Some genes may be represented in more than one functional category. Not all of the genes are classified and thus do not fall into one of the functional categories represented here. Those categories with an EASE score of <0.05 are underlined. A: Of the 136 genes from the 4 h Dex treatment, 63 were classified. B: Of the 86 genes from the 16 h Dex treatment, 28 were classified. Table 6 indicates the number of transcripts that were upregulated or downregulated in each of the functional categories. Although the results did not reveal a specific functional category affected by GC treatment, is consistent with and may account for the inability of researchers, thus far, to identify a change in a molecular function with GC treatment of LECs in vivo.
