![]() Figure 5 of
Gupta, Mol Vis 2005;
11:1018-1040.
Figure 5 of
Gupta, Mol Vis 2005;
11:1018-1040.
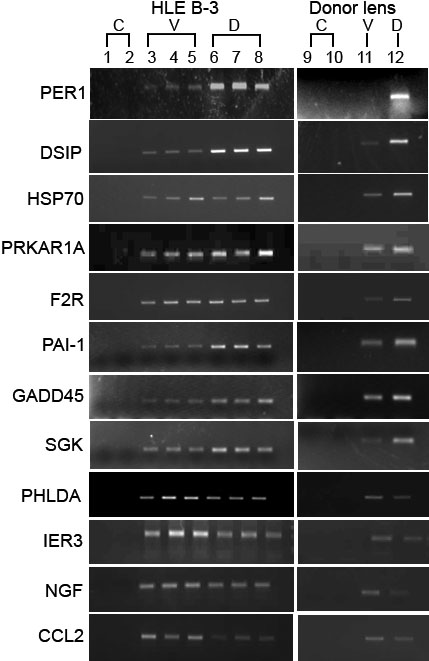
Figure 5. Agarose gel analysis of RT-PCR products in 4 h treated samples
RT-PCR products were electrophoresed on 1 or 2% agarose gels to examine product specificity. Gel analysis results were consistent with quantification of RT-PCR products by crossing point analysis (listed in Table 4). Similar results were obtained for the 16 h treated samples (data not shown). Lanes 1 and 9 are minus template negative controls (C), lanes 2 and 10 are minus reverse transcriptase negative controls (C), lanes 3, 4, 5, and 11 are vehicle (V) controls, and lanes 6, 7, 8, and 12 are treated with 1 μM dexamethasone (D).