![]() Figure 2 of
Otteson, Mol Vis 2005;
11:986-995.
Figure 2 of
Otteson, Mol Vis 2005;
11:986-995.
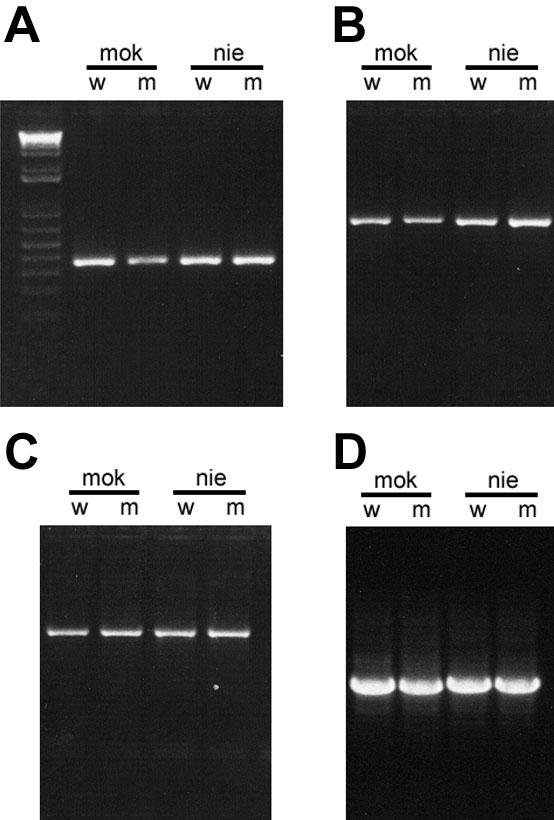
Figure 2. PCR amplification zebrafish crx fragments from genomic DNA used for sequence analysis
Photographs of ethidium bromide-stained agarose gels showing representative PCR amplifications of zebrafish crx from genomic DNA isolated from mok (mikre oko), nie (niezerka) homozygous mutants (m) and their phenotypically wild-type sibs (w) using primers listed in Table 1. A: 5' end of Exon 1 including repetitive region within 5' untranslated region (UTR). B: 5' coding region of Exon 3 and flanking portion of Intron 2. C: 3' end of coding region of exon 3 and repetitive sequences in 3' UTR. D: Intron 2 shows a small, but detectable difference in the size between mok (1026 bp) and nie (1064 bp) although within each line, the amplicons from homozygous mutant and wild-type sibs co-migrate.