![]() Figure 5 of
Zhang, Mol Vis 2005;
11:977-985.
Figure 5 of
Zhang, Mol Vis 2005;
11:977-985.
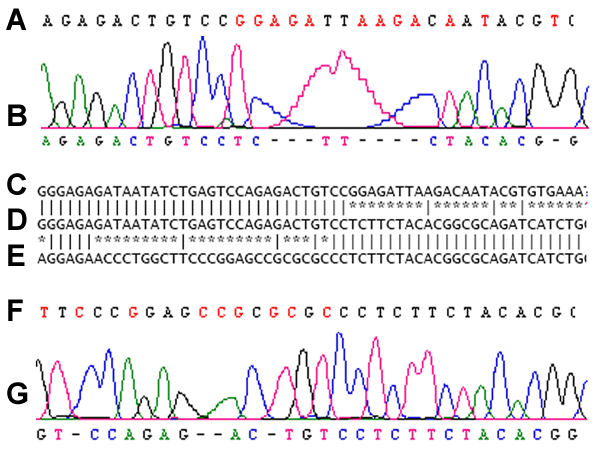
Figure 5. Sequence of the GRK1 mutation
Results of direct cycle sequencing are illustrated for the smaller band resulting from primers D1-E3R shown in Figure 1. Bidirectional sequencing revealed a homozygous 1118 bp deletion in individuals 11, 13, and 15 involving 1062 bp from Intron 2 and 56 bp from Exon 3. A,B: An alignment of a patient sequence (B) is shown with the 5' breakpoint normal sequence (A). The red bases in A as well as in F are generated by the SeqMan program and highlighted the unmatched or mismatched bases. C-E: Comparison of the 5' breakpoint sequence (C), patient sequence (D), and 3' breakpoint sequence (E) is depicited. Vertical lines indicate identical bases between two adjacent sequences and asterisks represent different bases between two adjacent sequences. F,G: An alignment of a patient sequence (G) with the 3' breakpoint normal sequence (F) is indicated.
