![]() Figure 1 of
Zhang, Mol Vis 2005;
11:977-985.
Figure 1 of
Zhang, Mol Vis 2005;
11:977-985.
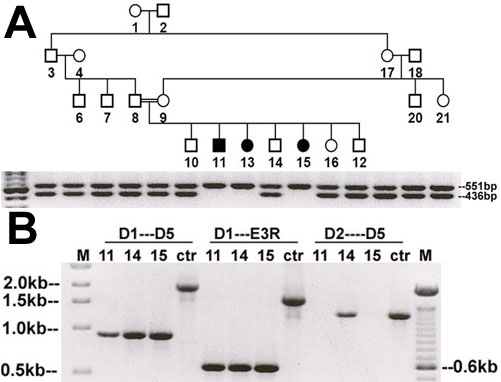
Figure 1. Diagrams for identification of GRK1 deletion
A: Absence of Exon 3 PCR products in three patients was found by multiplex PCR using primers for Exon 1b and Exon 3 as well as Exon 6b and Exon 3 (data not shown for the latter). The first lane in the gel image is the size standards of 100 bp ladder where the heavy band indicates 500 bp. Other lanes represent the results from the nearest individuals immediately above that lane. B: The location of the deletion was narrowed down by various combinations of different primers situated between Exon 2 and Exon 4. Ctr represents normal controls. The results showed that affected individuals 11 and 15 have a homozygous deletion. Unaffected individual 14 has a heterozygous deletion so that he is a carrier. Absence of normal PCR products and addition of a smaller band were found in individuals 11, 14, and 15 by using primer pairs D1-D5 and D1-E3R. This indicates a partial deletion of at least one allele between primers D1 and E3R. The lack of PCR products in individuals 11 and 15 with primers D2-D5 implies a homozygous deletion involving D2 in these patients. The presence of a 1.5 kb band in individual 14 and in a normal control subject (ctr) for primers D2-D5 indicates that individual 14 also has a normal allele apart from an allele with a deletion. Hence, individual 14 is an unaffected heterozygous carrier. C: The relative genomic position of the deletion is illustrated together with the primers used to identify the bounds of the deletion (not to scale).