![]() Figure 2 of
Coleman, Mol Vis 2004;
10:720-727.
Figure 2 of
Coleman, Mol Vis 2004;
10:720-727.
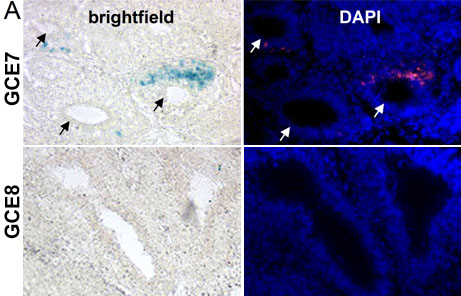
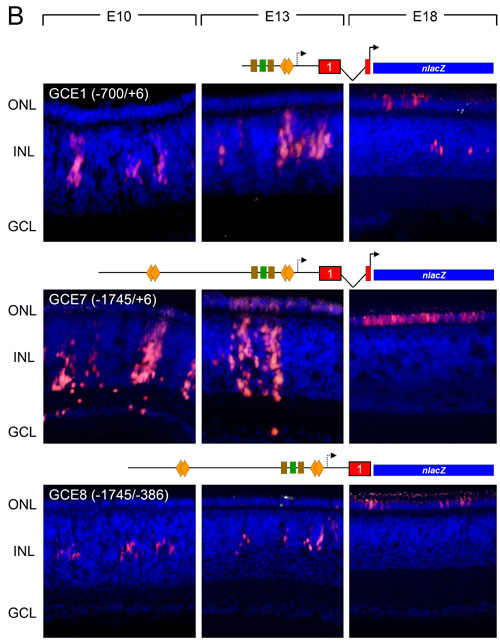
Figure 2. Cell specific and developmental activity of human retGC1 promoters
A: Brightfield (left panels) and brightfield-DAPI merged images (right panels) of cross sections of embryonic age (E) 18 pineal glands transduced with either the GCE7-nlacZ (GCE7) or the GCE8-nlacZ (GCE8) lentiviral vector. Arrows indicate lumens in the field of view with pinealocytes positioned around the perimeter. X-gal staining is shown as blue under brightfield optics (left panels) or red in the negative image overlaid with the DAPI image to show cell positions (right panels). B: Brightfield-DAPI merged images showing cross sections of retinas taken from stage 10-13 embryos injected with lentiviral vectors containing the GCE1, GCE7 or GCE8 promoter-nlacZ transgenes (shown schematically above the image panels) and harvested at E10, E13, or E18. X-gal staining is red (nlacZ positive cells) and DAPI staining is blue (cell nuclei). The outer nuclear layer (ONL), inner nuclear layer (INL), and ganglion cell layer (GCL) are labeled. The vector diagrams are described in Figure 1A.