![]() Figure 1 of
McColm, Mol Vis 2004;
10:512-520.
Figure 1 of
McColm, Mol Vis 2004;
10:512-520.
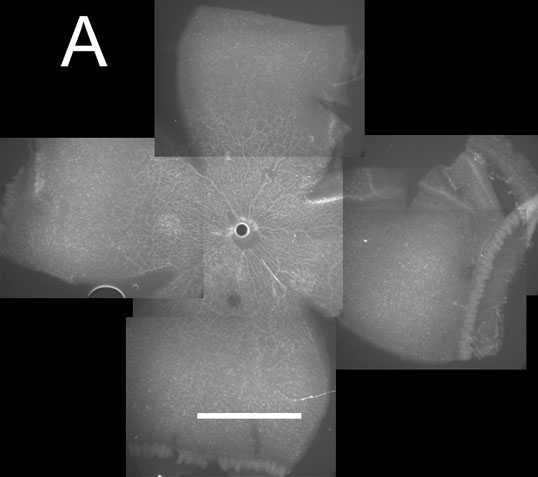
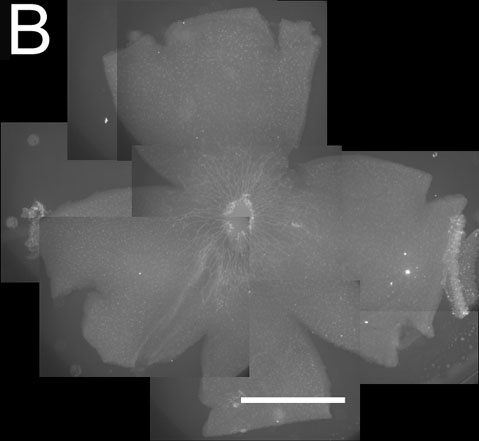
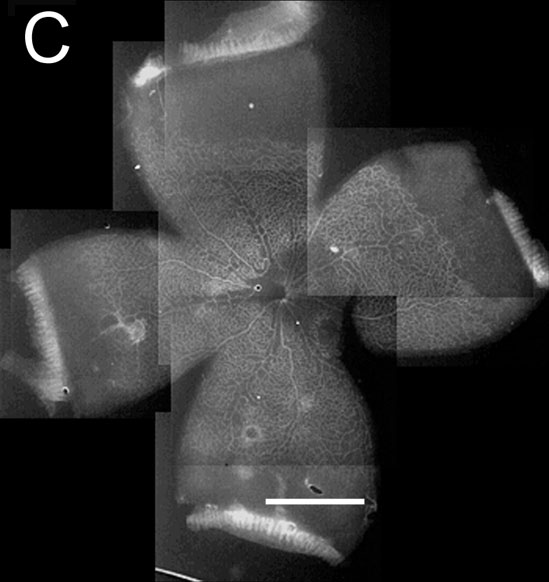
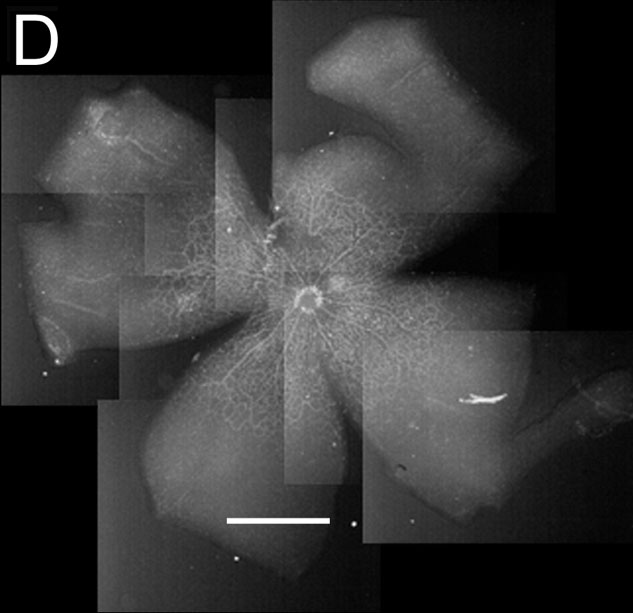
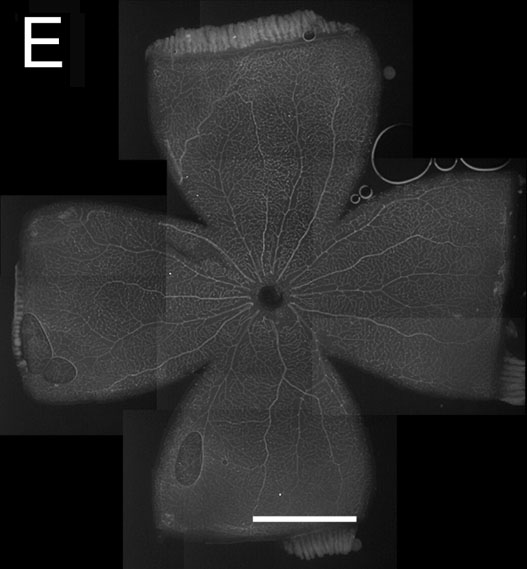
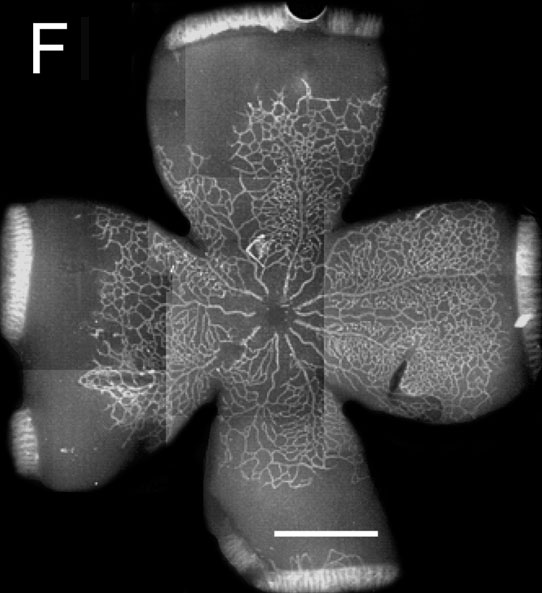
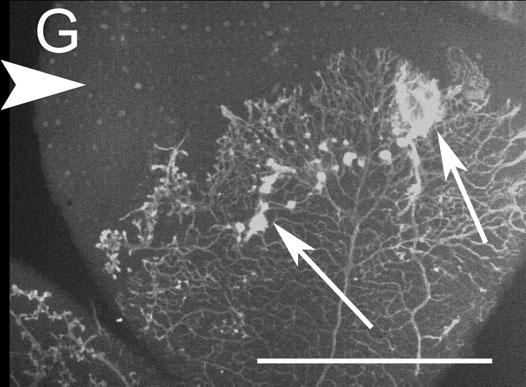
Figure 1. Lectin stained retinas from the room air control and 50/10 OIR groups
Blood vessels are white. A: P2 room air (RA) controls. B: P2 50/10 OIR model, 24 h of 50% oxygen followed by 24 h of 10% oxygen. The retinal vasculature is not only retarded but is also visibly less complex than the control (A). C: P7 RA controls. D: P7 50/10 OIR model after 3.5 cycles of 24 h of 50% oxygen, 24 h of 10% oxygen. The retinal vasculature is still delayed compared to the RA control (C). E: P14 RA control. The retina is fully vascularized and this is similar to the appearance of the RA control retina at P18. F: P14 50/10 OIR after 7 cycles of 24 h of 50% oxygen, 24 h of 10% oxygen. The retinal vasculature has covered about the same area as the P7 RA control (C) but appears much less dense. G: P18 experimental after 7 cycles of 24 h of 50% oxygen, 24 h of 10% oxygen and then 4 days in room air. This image of one of the quadrants shows the persistent avascular area (arrowhead) and tufts of endothelial cells (arrows) from intravitreous neovascularization. Scale bars represent 1.5 mm. See Table 1 for a quantification of avascular areas.