![]() Figure 5 of
Tasheva, Mol Vis 2004;
10:403-416.
Figure 5 of
Tasheva, Mol Vis 2004;
10:403-416.
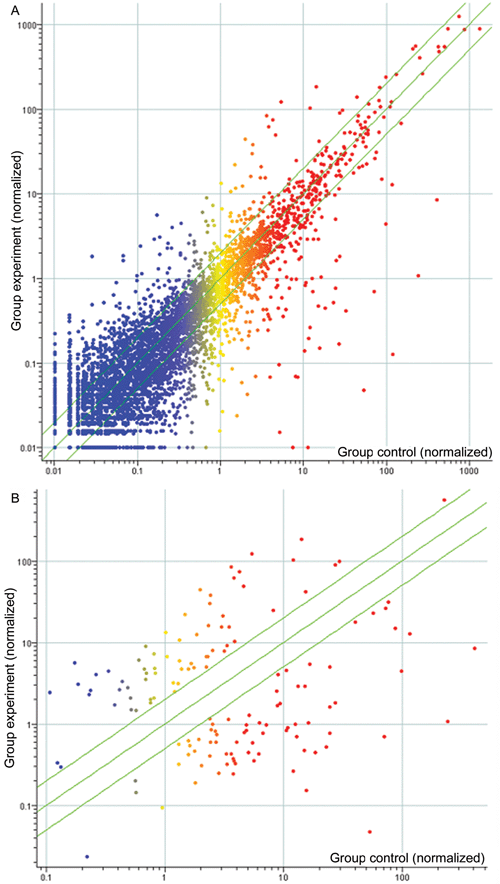
Figure 5. Scatter-plots of gene expressions
The normalized expression index for experimental groups (y-axis) and control groups (x-axis) is indicated by a color code. Red, yellow, and blue spots indicate that expression of the gene in control groups (x-axis) is greater than, equal to or less than 1. A: Scatter-plot with all genes spotted on the microarray. B: Scatter-plot with 141 differentially expressed genes.
