![]() Figure 4 of
Tasheva, Mol Vis 2004;
10:403-416.
Figure 4 of
Tasheva, Mol Vis 2004;
10:403-416.
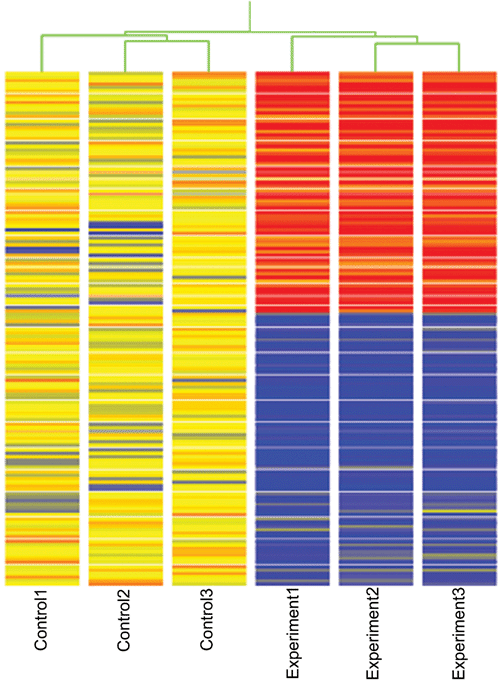
Figure 4. Hierarchical clustering of gene expressions
Each row represents a separate gene and each column a separate sample. 141 genes have been selected which are differentially expressed in experiments compared to control samples. The normalized expression index for each gene (rows) in each sample (columns) is indicated by a color code. Red, yellow and blue squares indicate that expression of the gene is greater than, equal to or less than the mean level of expression across all 3 control samples.
