![]() Figure 3 of
Cullinan, Mol Vis 2004;
10:315-322.
Figure 3 of
Cullinan, Mol Vis 2004;
10:315-322.
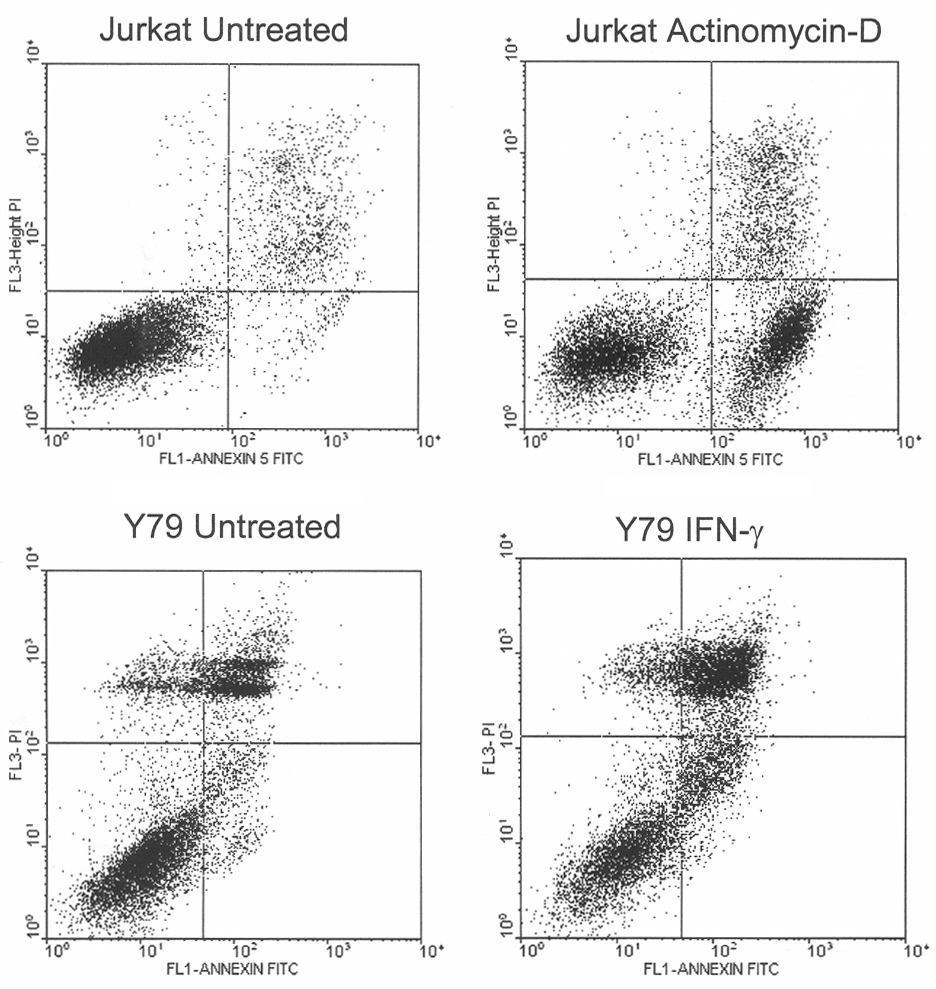
Figure 3. Analysis of annexin V staining in cytokine treated retinoblastoma cells
A total of 1x10⁶ cells were treated with cytokines, as described in the legend to Figure 2. The cells were then permeablized, stained for annexin V, and stored on ice until analyzed by FACS. The upper panels show representative examples of control Jurkat cells either untreated (left) or treated with actinomycin-D to induce apoptosis (right). The lower panels show untreated and IFN-γ-treated Y79 cells. Increased annexin V staining was seen in Weri Rb-1 cells only in the presence of both cytokines (data not shown). In all panels, cells in the lower left quadrant are alive, cells in the lower right quadrant are in early apoptosis, in the upper right are in late apoptosis, and cells in the upper left quadrant are dead.
