![]() Figure 1 of
Ohngemach, Mol Vis 2004;
10:1019-1027.
Figure 1 of
Ohngemach, Mol Vis 2004;
10:1019-1027.
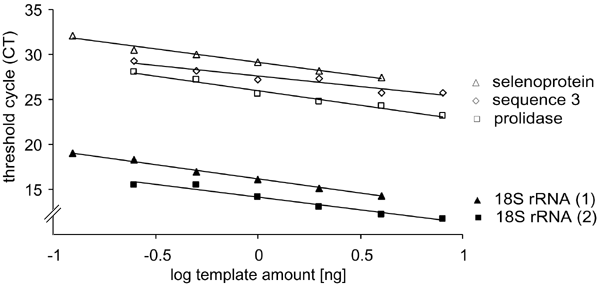
Figure 1. Determination of the efficiency of amplification for several primer sets
Threshold cycles (CT) are shown as a function of the logarithm of the template amount of mRNA. Standard curves were generated by two fold dilution series with template amounts ranging from 8 ng to 0.125 ng RNA per well.
