![]() Figure 7 of
Heys, Mol Vis 2004;
10:956-963.
Figure 7 of
Heys, Mol Vis 2004;
10:956-963.
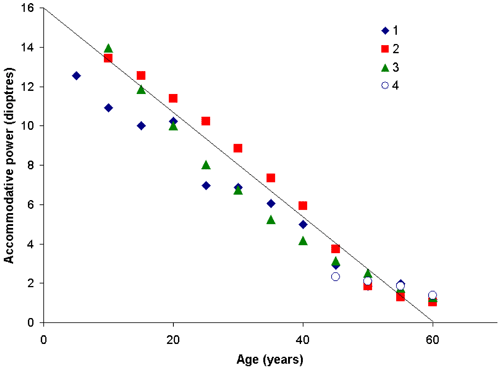
Figure 7. Change in accommodative power (diopters) as a function of age
Accommodative power of human subjects expressed as a function of age. The data points on the graph represent a summary of four separate studies on human accommodation as indicated by the following references. Data were taken from [49] for curve 1 (blue diamond), from [50] for curve 2 (red square), from [51] for curve 3 (green triangle), and from [52] for curve 4 (open circle). This includes the regression of a straight line as modified from Pierscionek and Weale [53].
