![]() Figure 4 of
Zhang, Mol Vis 2004;
10:890-900.
Figure 4 of
Zhang, Mol Vis 2004;
10:890-900.
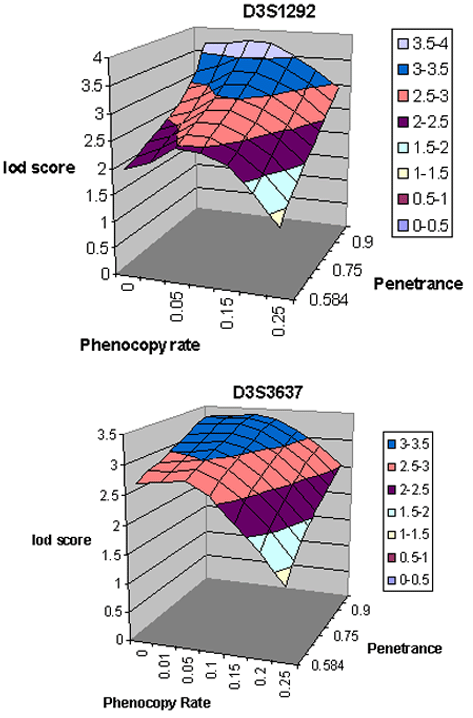
Figure 4. Three dimensional view of lod scores under different penetrance and phenocopy rates
Variation of the lod score with changes in the inheritance model. Phenocopy rates and penetrances yielding significant lod scores (>3) are shown by the projection of the blue shaded region of the surface on the X and Y axes, respectively. Lod scores are shown on the Z axis. The results shown here graphically are taken from data shown in Table 4.
