Figure 5. Gene expression profiles in human induced pluripotent stem cell-derived retinal pigment epithelium cells following 24 h NaIO3-induced oxidative stress. Gene expression levels of A: Vascular endothelial growth factor A (VEGFA), B: Hypoxia-inducible factor 1-alpha (HIF1A), C: Thioredoxin (TXN), D: Thioredoxin interacting protein (TXNIP), E: Gamma-glutamylcyclotransferase 1 (CHAC1) and F: Cystine/glutamate antiporter (SLC7A11) were normalized to control condition. One-way ANOVA followed by Dunnett’s multiple comparison test were performed for statistical
analyses. *p < 0.05, **p < 0.01, ***p < 0.001, ****p < 0.0001. Each technical replicate is shown as a single data point with
mean ± SD (n = 6).
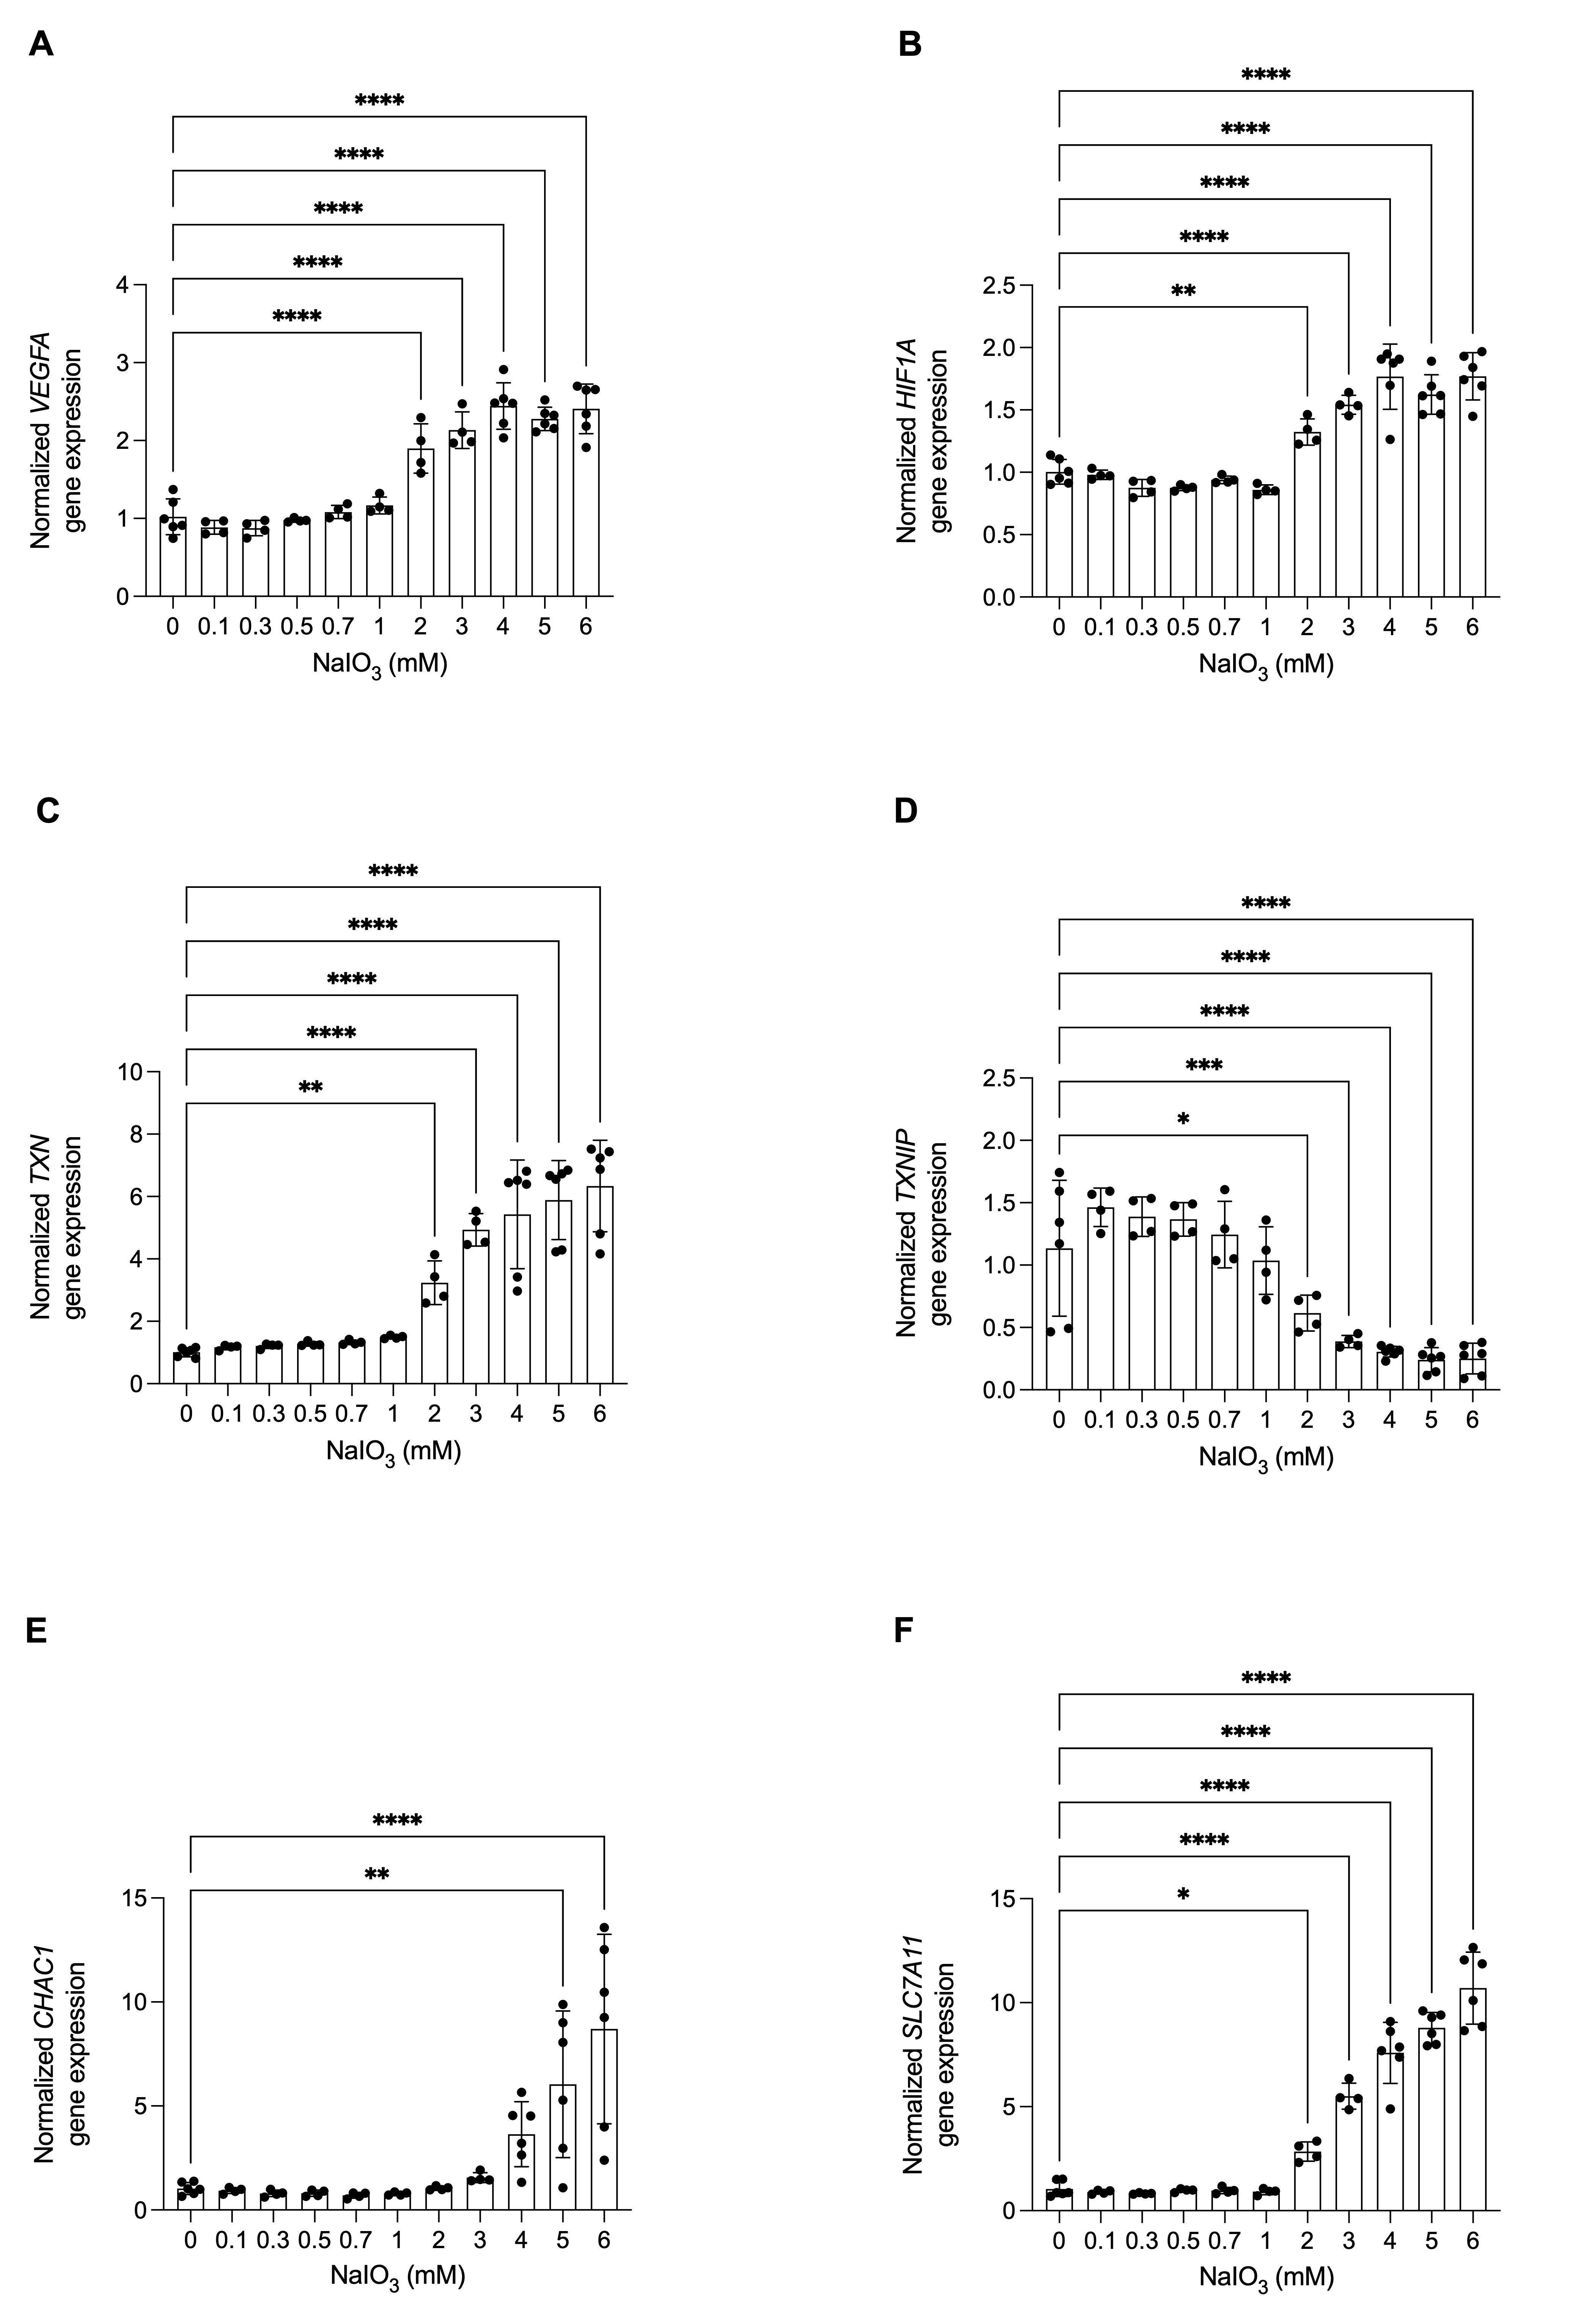
 Figure 5 of
Kolehmainen, Mol Vis 2026; 32:421-433.