![]() Figure 3 of
Wunderlich, Mol Vis 2003;
9:756-761.
Figure 3 of
Wunderlich, Mol Vis 2003;
9:756-761.
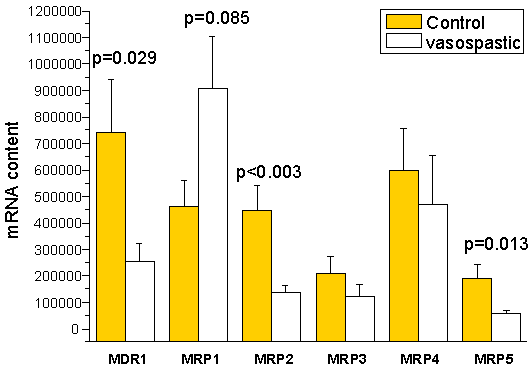
Figure 3. Gene expression of MDR1 and MRP isoforms
Mean gene expression of MDR1 and MRP isoform (MRP1 to MRP5) genes in healthy controls and vasospastic persons. Error bars represent the standard error of the mean.
