![]() Figure 7 of
Haque, Mol Vis 2003;
9:52-59.
Figure 7 of
Haque, Mol Vis 2003;
9:52-59.
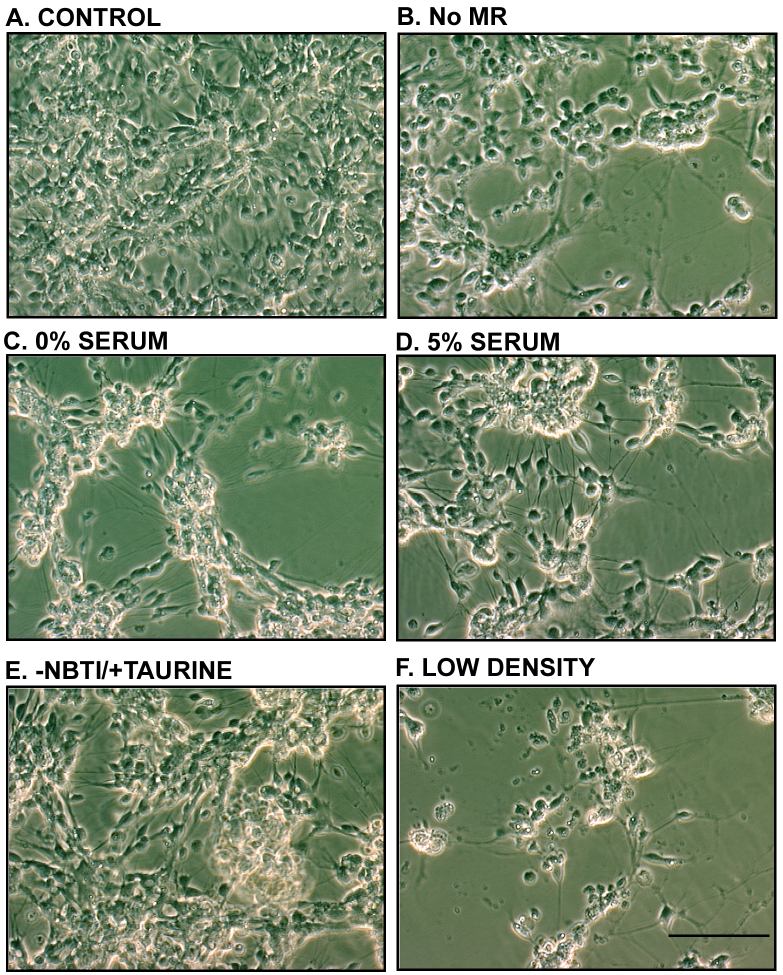
Figure 7. Representative photomicrographs of retinal cells on DIV 6 following incubation in different conditions that affect the expression of AANAT rhythms
A: Control: cultures were seeded at a density of 9x10⁶ cells/60 mm dish in a 10% fetal bovine serum containing medium as described in Methods; medium was replaced on DIV 4 with a medium containing 1% serum and 5 μM NBTI. B: No MR: cultures seeded as in A, but medium was not replaced on DIV 4. C: 0% Serum: cultures seeded as in A; medium replaced on DIV 4 with serum-free medium containing 5 μM NBTI. D: 5% Serum: cells seeded as in A; medium replaced on DIV 4 with a medium containing 5% serum and 5 μM NBTI. E: -NBTI/+Taurine: cells seeded as in A; medium replaced on DIV 4 with a medium containing 1% serum and 5 mM taurine, without NBTI. F: Low density: cultures were seeded at a density of 4.5x10⁶ cells/60 mm dish in 10% fetal bovine serum containing medium; medium was replaced on DIV 4 with a medium containing 1% serum and 5 μM NBTI. All micrographs were taken at 250x magnification. The magnification bar in panel F represents 60 mm.