![]() Figure 4 of
Rhee, Mol Vis 2003;
9:715-722.
Figure 4 of
Rhee, Mol Vis 2003;
9:715-722.
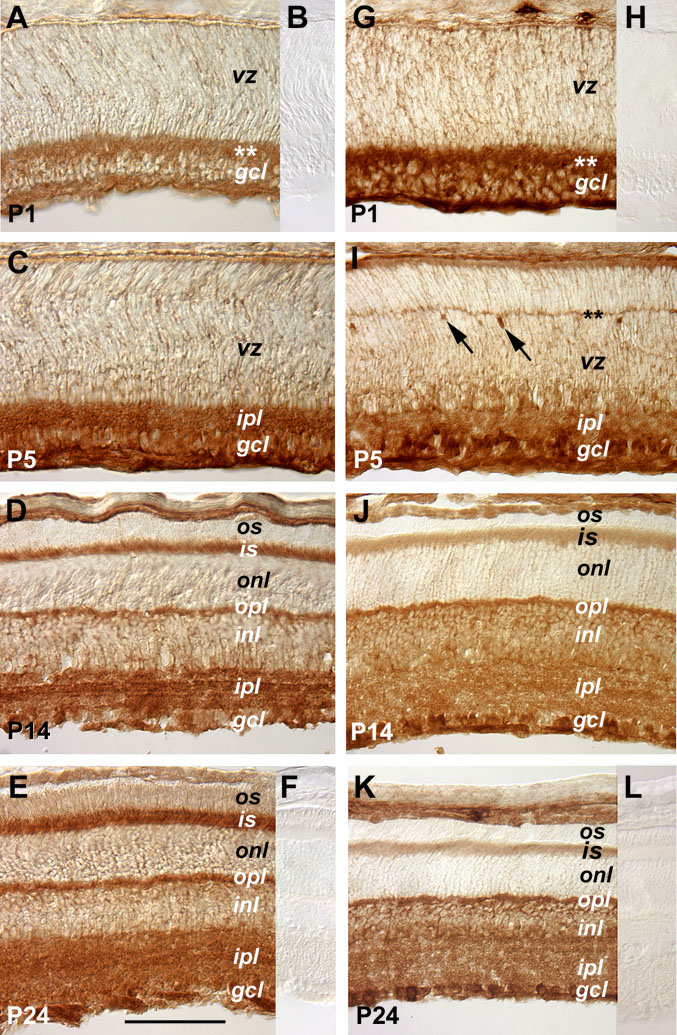
Figure 4. Expression of STAT1 and STAT3 signal transducers
Cryosections of retinas from distinct postnatal ages immunohistochemically stained for STAT1 (A, C, D, E) and STAT3 (G, I, J, K) are shown. Panels B, F, H, and L show staining results of primary antibodies preincubated with the antigen peptides for the corresponding sections shown in A, E, G, K, respectively. The asterisks indicate the positions of the developing inner plexiform layer at P1 (A, G) and the emerging outer plexiform layer at P5 (I). The scale bar shown in panel E represents 100 μm for all panels. Arrows in I point to strongly stained cells located adjacent to the forming outer plexiform layer. The meanings of the abbreviations referred to in this figure are: gcl (ganglion cell layer), inl (inner nuclear layer), ipl (inner plexiform layer), is (inner segment), onl (outer nuclear layer), opl (outer plexiform layer), os (outer segment), rpe (retinal pigmented epithelium), vz (ventricular zone).