![]() Figure 2 of
Sherry, Mol Vis 2003;
9:673-688.
Figure 2 of
Sherry, Mol Vis 2003;
9:673-688.
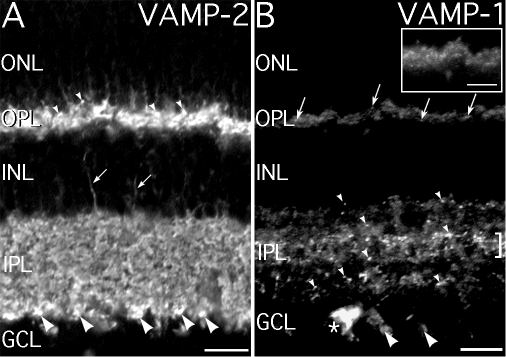
Figure 2. VAMP-1 and VAMP-2 are differentially distributed in the mouse retina
A: Intense labeling for VAMP-2 is present in both the OPL and IPL. Photoreceptor terminals (small arrowheads) in the OPL show strong labeling. Numerous terminals throughout the IPL show intense labeling for VAMP-2, including a population of large terminals in the innermost portion of the IPL where the rod bipolar cell terminals reside (large arrowheads). A few slender processes that show VAMP-2 labeling (arrows), most likely bipolar cell axons, can be seen descending through the INL. B: Labeling for VAMP-1 is present in the OPL and IPL, but is more restricted in distribution than VAMP-2 labeling. Weak labeling of photoreceptor terminals (arrows) is visible in the OPL. Puncta labeled for VAMP-1 are distributed throughout the IPL (small arrowheads), but a broad plexus of prominently labeled puncta is present in the mid-IPL (square bracket symbol). An intensely labeled cell body (*) is visible in the ganglion cell layer (GCL). Axon bundles along the inner edge of the retina also show labeling (large arrowheads). Inset: VAMP-1 immunolabeling in the OPL. ONL, outer nuclear layer. Scale bars represent 20 μm for A and B; 10 μm for inset in B.