![]() Figure 4 of
Lee, Mol Vis 2003;
9:624-634.
Figure 4 of
Lee, Mol Vis 2003;
9:624-634.
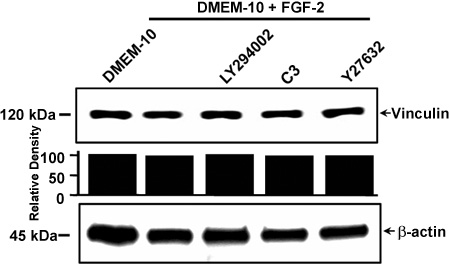
Figure 4. Expression of vinculin
First passage CECs (3x10⁵) plated in 60 mm dishes were maintained in DMEM-10 in the presence or absence of 10 ng/ml of FGF-2. On day 3, cells were further treated for 24 h with 20 μM of LY294002, 10 μM of Y27632, or 5 μg/ml of C3 exoenzyme. Cell lysates were prepared and immunoblotting analysis was performed. β-actin was used for control of protein concentration on western blot analysis. Relative density of vinculin was determined using the Gel Doc Documentation System (Bio-Rad). Data shown are representative of three experiments.