![]() Figure 3 of
Hartwick, Mol Vis 2003;
9:594-600.
Figure 3 of
Hartwick, Mol Vis 2003;
9:594-600.
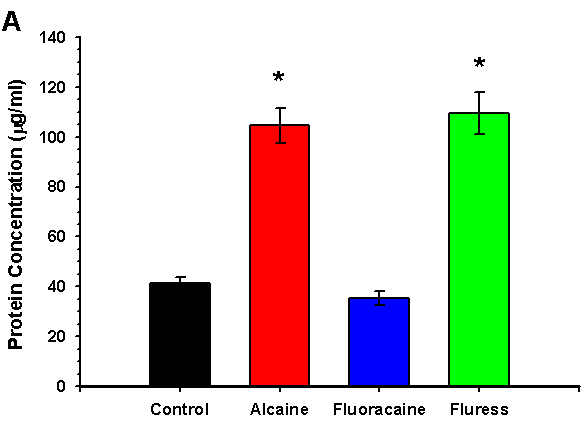
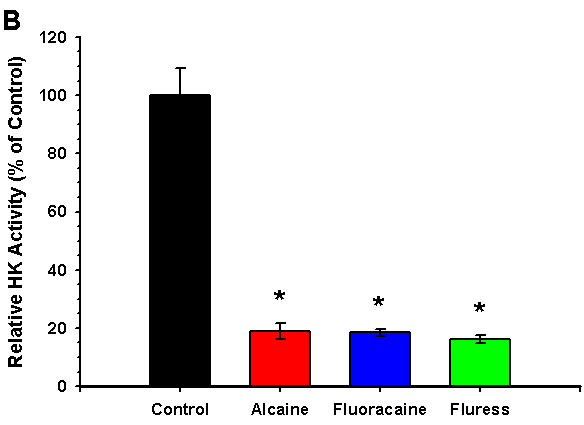
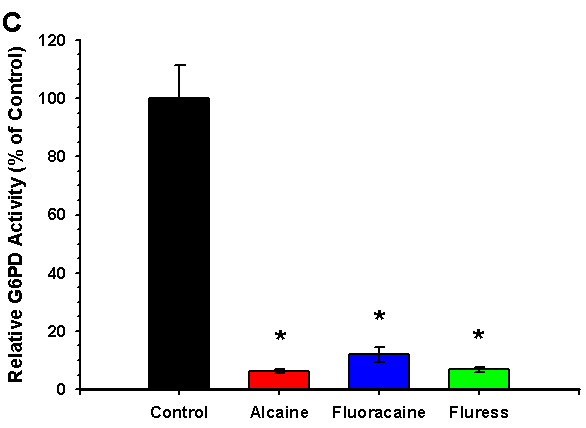
Figure 3. Epithelial enzyme activity in lenses recovering from anesthetic-induced optical changes
A: The mean protein concentration (μg/ml) of the epithelial supernatant for each treatment group and controls. Relative enzyme activity (±SEM) of HK (B) and G6PD (C), normalized to the control group (%), in epithelial cell sonicate from bovine lenses exposed to Alcaine®, Fluoracaine®, or Fluress® for 2 h (n=14 in each group). The assays were performed 24 h following the 2 h exposure to each anesthetic. The asterisk indicates significant differences (p<0.01) compared to controls.


