![]() Figure 1 of
Hartwick, Mol Vis 2003;
9:594-600.
Figure 1 of
Hartwick, Mol Vis 2003;
9:594-600.
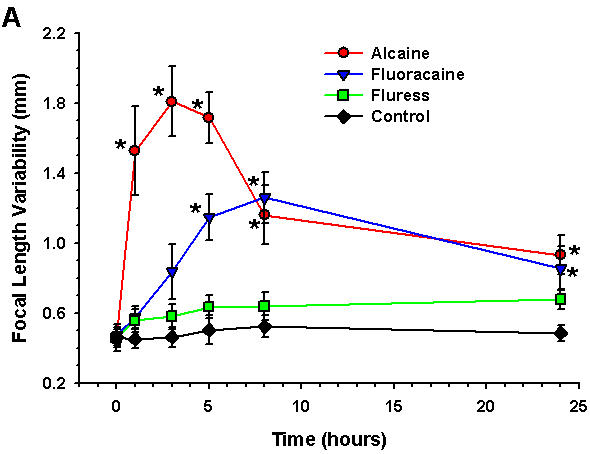
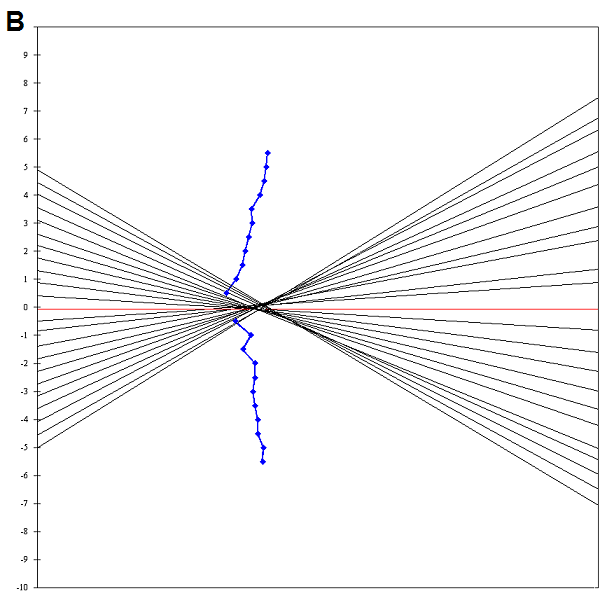
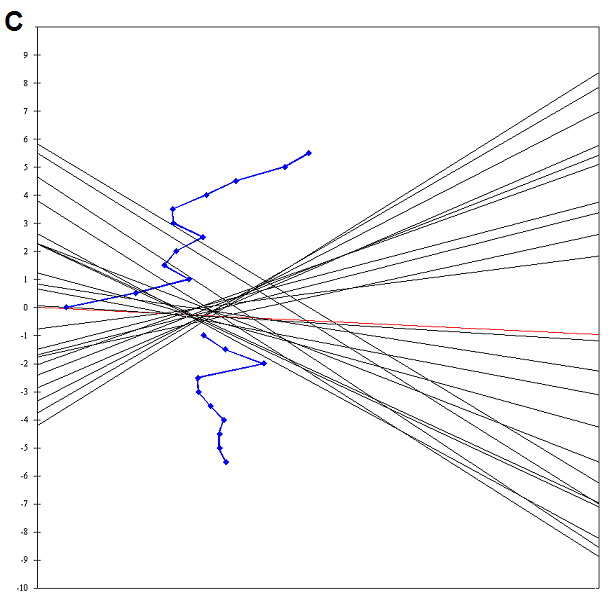
Figure 1. Effect of anesthetics on cultured bovine lens optical quality
A: Mean results (±SEM) for the focal length variability (FLV) as a function of time (h) measured in the cultured lenses exposed for 2 h to the anesthetic solutions (Alcaine®, Fluoracaine®, or Fluress®) and controls (n=14 in each group). The zero time point represents the pre-exposure focal length variability. The asterisk indicates significant differences (p<0.01) compared to control group. Example focal length profiles for a control lens (B) and a lens 1 h following the 2 h exposure to Alcaine® (C). The eccentricity (mm) of the laser beam from the optical axis (0 point) is shown on the vertical axis. The diamond points connected by the blue line indicate where the refracted beam crosses the optical axis for each eccentric beam position. The alignment of the diamond points is indicative of FLV. The diamonds are better aligned vertically in the control lens (small FLV) than in the Alcaine® treated lens (higher FLV).


