![]() Figure 2 of
Qaddoumi, Mol Vis 2003;
9:559-568.
Figure 2 of
Qaddoumi, Mol Vis 2003;
9:559-568.
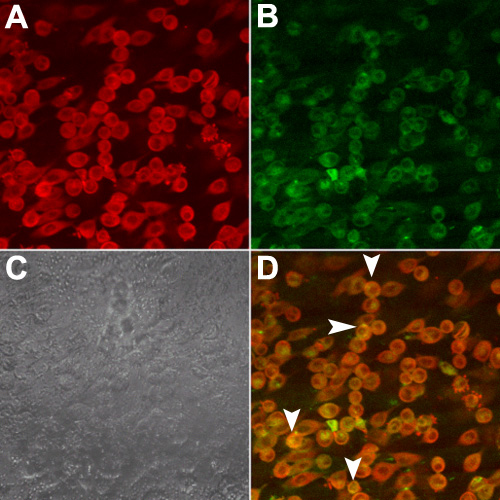
Figure 2. Confocal microscopy of RCECs following uptake of PLGA nanoparticles
A and B represent x-y confocal images (40x magnification) scanned below the apical layers of sub-confluent RCECs (80% confluency). A: RCECs stained with clathrin HC antibody (red). B: Uptake of PLGA nanoparticles containing coumarin (green) after incubation for 30 min at 37 °C. C: Phase contrast image of RCECs. D: Merged image of A and B showing partial colocalization of the staining of coumarin-nanoparticles with that of clathrin HC. Areas of overlap are denoted by arrowheads. These findings were confirmed with magnification of up to 100x, however, for best illustrative quality without compromising image resolution only the 40x magnified specimens are shown.