![]() Figure 3 of
Ruotolo, Mol Vis 2003;
9:538-548.
Figure 3 of
Ruotolo, Mol Vis 2003;
9:538-548.
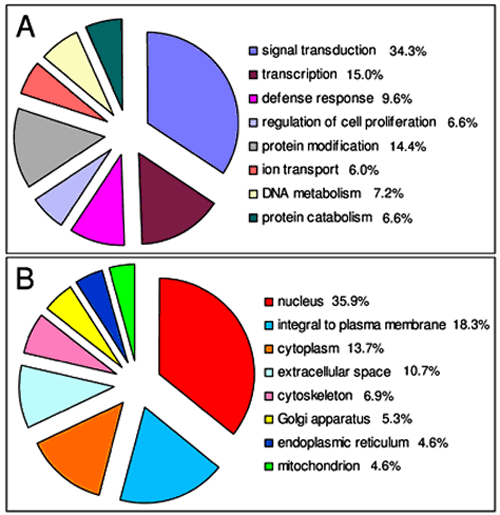
Figure 3. Distribution of cataract-downregulated genes in different Gene Ontology categories
Pie chart showing the distribution of cataract-downregulated genes in the "Biological process" (A) and "Cellular component" (B) functional categories of the Gene Ontology classification [14]. Only the eight most populated classes are shown. The total number of genes shown in (A) and (B) is 166 and 131, respectively; the percentage of genes in each class is indicated in the inset legend.