![]() Figure 2 of
Ruotolo, Mol Vis 2003;
9:538-548.
Figure 2 of
Ruotolo, Mol Vis 2003;
9:538-548.
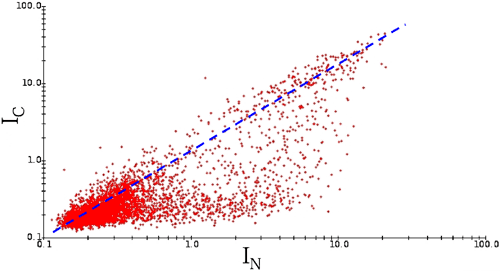
Figure 2. Representative scatterplot of the signal intensities derived from an N versus C comparison
The data shown are from hybridizations conducted with filter 2. Normalized signal intensity calculations and graph construction were performed with the Pathways 4 program. Dots lying above and below the blue dashed line (IC/IN=1) correspond to normalized signal intensities that are, respectively, higher and lower in cataractous than in transparent lens.