![]() Figure 4 of
Hawse, Mol Vis 2003;
9:515-537.
Figure 4 of
Hawse, Mol Vis 2003;
9:515-537.
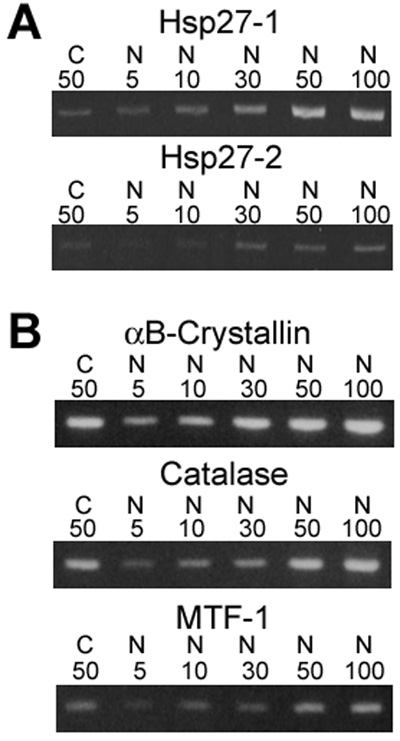
Figure 4. Further RT-PCR confirmation of selected gene expression differences and control genes
RT-PCR confirmation of gene expression differences for HSP27-1 and -2 (A) and 3 control genes whose expression levels should be equal between cataract (C) and normal (N) lens epithelia (B). The total amount of RNA (ng) used in each reaction is indicated.