![]() Figure 2 of
Huang, Mol Vis 2003;
9:502-507.
Figure 2 of
Huang, Mol Vis 2003;
9:502-507.
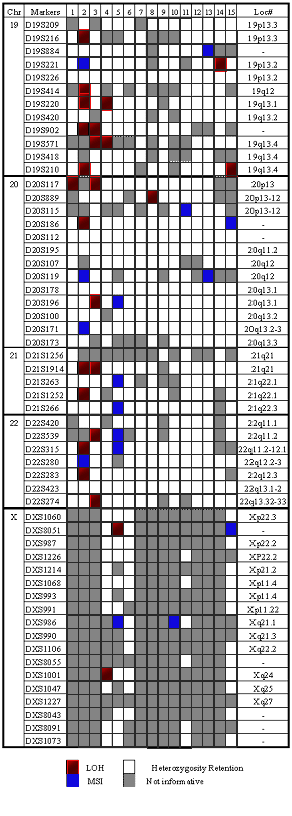
Figure 2. Tabular results of genome instability study of chromosomes 19, 20, 21, 22, and X
Each chromosome is delineated by a bold black line. All the 55 markers are listed according to their order on human physical maps. The last column (Loc#) provides the detailed physical maps location of each corresponding microsatellite marker, in which the "-" indicates inaccurate location although the relative physical location is known. The labels of the 15 retinoblastoma patients (RB) are indicated as 1, instead of RB-1 in order to minimize the image size of the full tabular results.
