![]() Figure 4 of
Proulx, Mol Vis 2003;
9:473-481.
Figure 4 of
Proulx, Mol Vis 2003;
9:473-481.
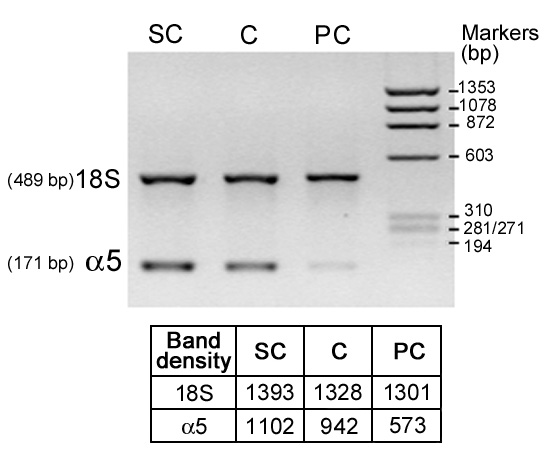
Figure 4. RT-PCR amplification of integrin α5 mRNAs
Upper panel. Integrin α5 amplification products were obtained from sub-confluent (sc), confluent (c) and post-confluent (pc) primary cultures of human RPE cells and normalized to the 18S PCR product for semi quantitative evaluation. The position of the integrin α5 (171 bp) and 18S (489 bp) amplification products are shown, along with that of the most representative DNA markers. Lower panel. Band was density calculated by the QuantityOne Image analysis software (see materials and methods).