![]() Figure 9 of
Fei, Mol Vis 2003;
9:31-42.
Figure 9 of
Fei, Mol Vis 2003;
9:31-42.
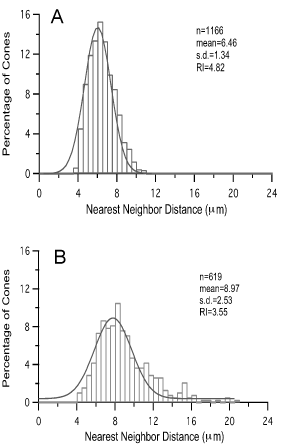
Figure 9. Quantitative analysis of cone mosaic in the adult mouse retina
The histograms represent the distribution of the measured NNDs of the fluorescent cones in the central (A) and the far peripheral (B) areas of the dorsal retinas. The lines represent the normal Gaussian function, which fitted well to the NND data. "N" is the number of fluorescent cones measured. The regularity index (RI) is determined by the mean and the standard deviation (s.d.) of the NND data, and is not affected by changing the bins of the histograms.