![]() Figure 7 of
Fei, Mol Vis 2003;
9:31-42.
Figure 7 of
Fei, Mol Vis 2003;
9:31-42.
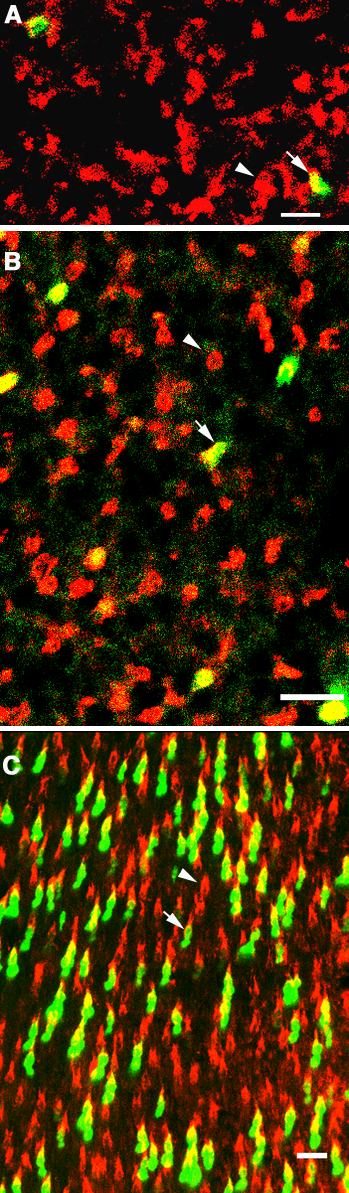
Figure 7. PNA labeling of the fluorescent cells during development
These are confocal images taken from the ventral (A and B) and dorsal (C) areas of PNA stained retinal wholemounts of P1 (A), P4 (B) and P10 (C) mice with focusing on the cone inner segments (A) and the outer segments (B and C). Each represents a merged image of the corresponding GFP (green) and rhodamine (red) images of the same filed, showing that all fluorescent cells (green) were labeled by PNA (red; arrow) although not every cone expressed the GFP (arrowhead). Scale bar represents 10 μm