![]() Figure 12 of
Fei, Mol Vis 2003;
9:31-42.
Figure 12 of
Fei, Mol Vis 2003;
9:31-42.
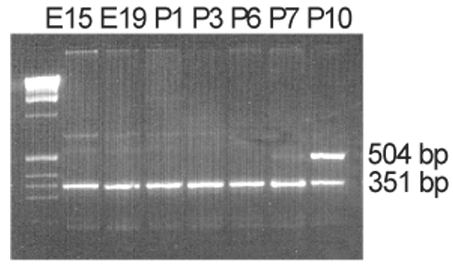
Figure 12. Temporal expression of the mouse cone opsin genes
RT-PCR analysis of the developmental expression of the mouse blue and green opsin genes in the mouse retinas. The 504 bp band was amplified from the mouse green opsin mRNA, and the 351 bp band was from the mouse blue opsin mRNA. The first lane is 1 kb DNA marker.