![]() Figure 10 of
Fei, Mol Vis 2003;
9:31-42.
Figure 10 of
Fei, Mol Vis 2003;
9:31-42.
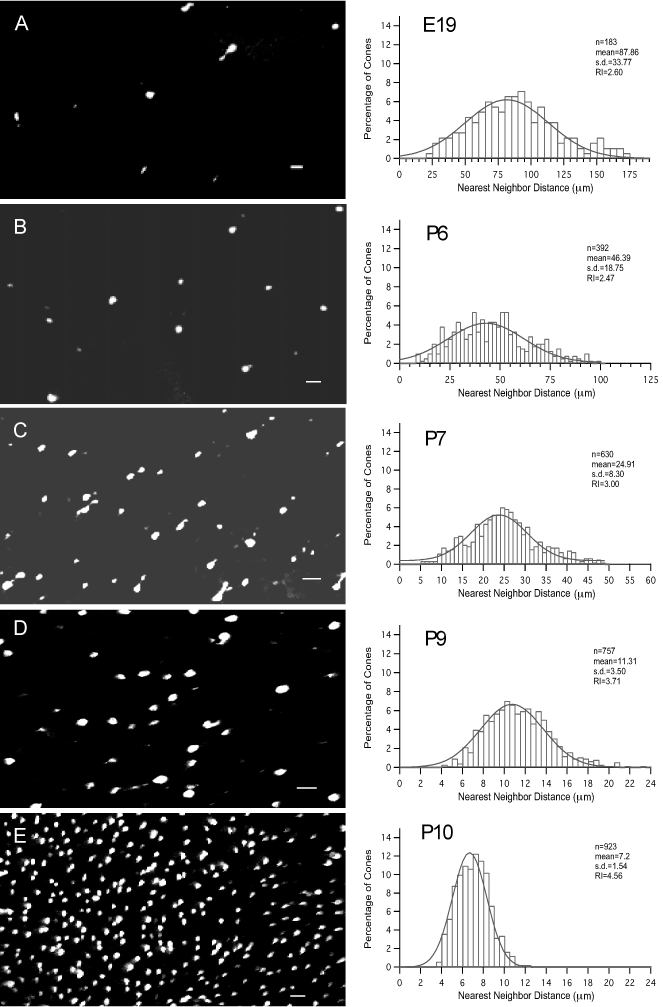
Figure 10. Patterning of the cone mosaic during retinal development
The left panels are representative views of the cone mosaic patterning in the developing mouse retinas. The right panels are the corresponding quantitative analysis of the spatial patterns. A-C: Images of the fluorescent cones taken from the dorsal retinas of mice aged at E19, P6 and P7, respectively, with an epifluorescence microscope (20x and 10x lens). D,E: Confocal microscope images of the fluorescent cones taken from the dorsal retinas of P9 and P10 (E) mice, respectively. The corresponding histograms in the right panels represent the distributions of the measured NNDs of the fluorescent cones in the sampled retinas of the E19, P6, P7, P9 and P10 transgenic mice. The lines represent the normal distribution. The regularity index (RI) did not change significantly from E19 to P6, but increased from P7 to P9 and approached to the adult level at P10. Note that there was a consistent tail towards the larger NND in these distributions. Scale bar represents 10 μm.