![]() Figure 3 of
Clout, Mol Vis 2003;
9:440-448.
Figure 3 of
Clout, Mol Vis 2003;
9:440-448.
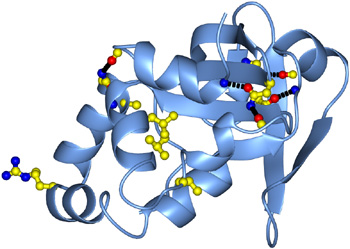
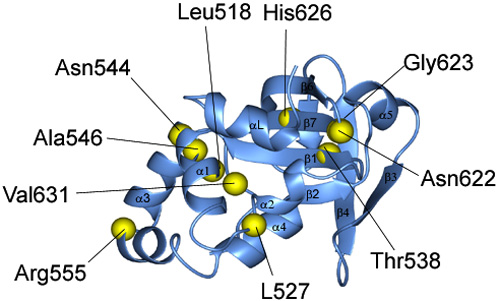
Figure 3. Location of missense mutations in βig-h3 causing corneal dystrophies
A: Shown is a cartoon representation of the model of domain 4 of βig-h3. Secondary structure elements of the fold are labelled. The positions of amino acid residues mutated in corneal dystrophies are marked by yellow spheres and labelled. B: Same as A, but with residues shown in atomic detail. Carbon atoms are yellow, oxygen atoms red, and nitrogen atoms blue. Hydrogen bonds are indicated by black broken lines. The animation provides a 360° view of the FAS1 domain fold, represented here by the model of domain 4 of βig-h3.
Note that the slide bar at the bottom of the quicktime movie can be used to manually control the flow of the movie. If you do not want to or are unable to view the movie, a representative frame is included below as a still image.
A:
B:
| This animation requires Quicktime 6 or later. Quicktime is available as a free download. |