![]() Figure 6 of
Wride, Mol Vis 2003;
9:360-396.
Figure 6 of
Wride, Mol Vis 2003;
9:360-396.
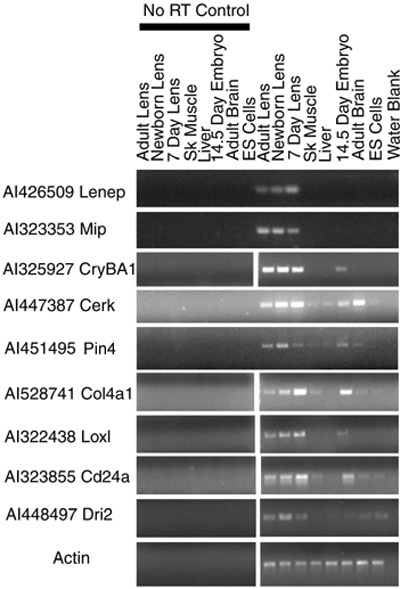
Figure 6. Genes preferentially expressed in the lens by semi-quantitative RT-PCR
PCRs shown are representative of at least three repetitions of each PCR. Where gaps exist between PCRs depicted for the same primer set, this is because the picture has been assembled from different lanes of the same gel. Actin controls show even band intensity across all of the samples. GAPDH controls gave similar results (not shown). For details of normalized intensity values for each of the samples for each gene, see Table 4.