![]() Figure 4 of
Wride, Mol Vis 2003;
9:360-396.
Figure 4 of
Wride, Mol Vis 2003;
9:360-396.
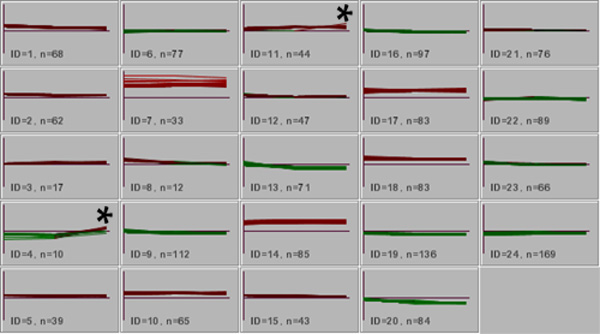
Figure 4. K-Means clustering of lens samples to identify clusters of genes within the data set
Cluster IDs L4 and L11 (marked with an asterisk) were selected for follow up. Cluster L4 was selected because the mean intensity value in the 7 day old lens samples exhibited at least two-fold higher expression than the mean value for the newborn and adult samples. Cluster L11 was selected because one gene in the 7 day old lens sample exhibited two-fold higher expression than the mean value of the newborn and adult sample intensity values. The designation "n" equals the number of genes in each cluster.