![]() Figure 2 of
Wride, Mol Vis 2003;
9:360-396.
Figure 2 of
Wride, Mol Vis 2003;
9:360-396.
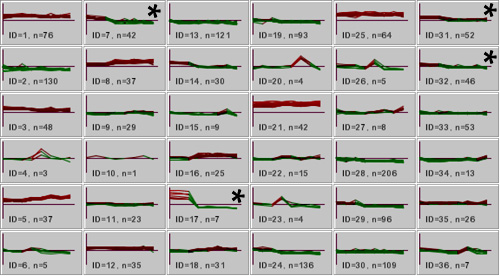
Figure 2. K-Means clustering of all samples to identify clusters within the data set
Clusters IDs 7, 14, 17, and 31 (marked with an asterisk) were selected for further analysis, since the mean spot intensity of the three lens samples indicated greater than two-fold higher expression than the mean value for the non-lens samples. The designation "n" indicates the number of genes in each cluster.