![]() Figure 7 of
Chen, Mol Vis 2003;
9:345-354.
Figure 7 of
Chen, Mol Vis 2003;
9:345-354.
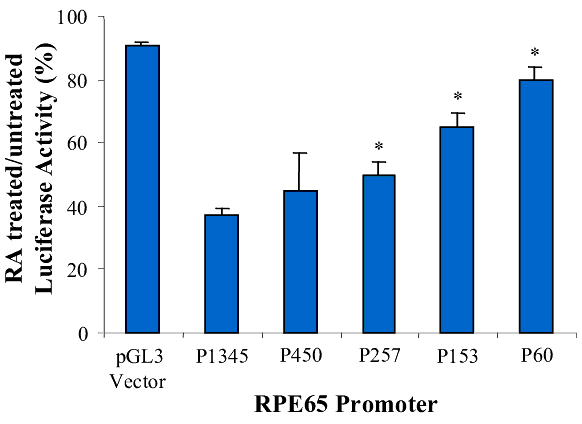
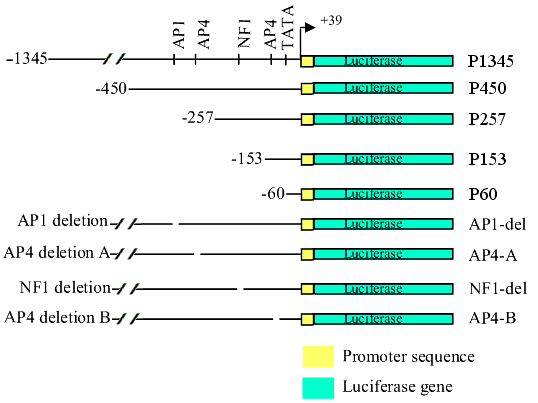
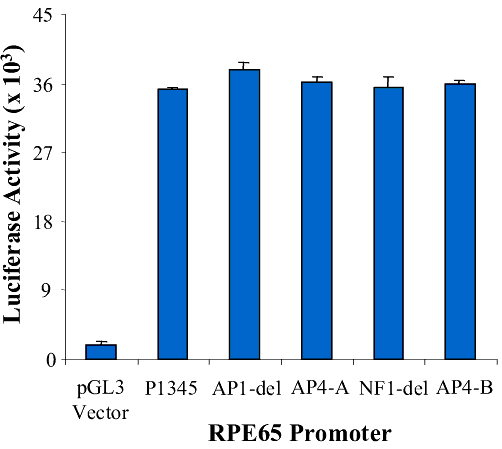
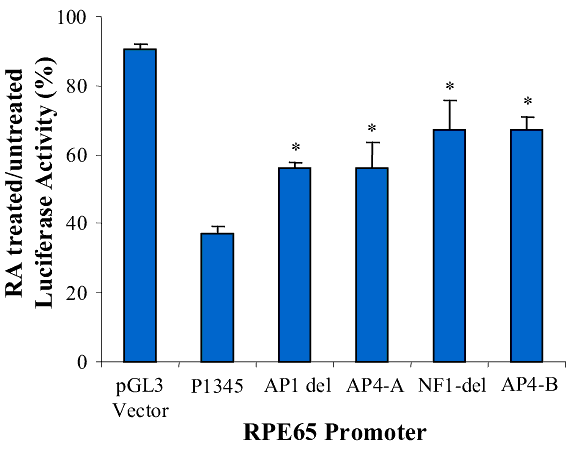
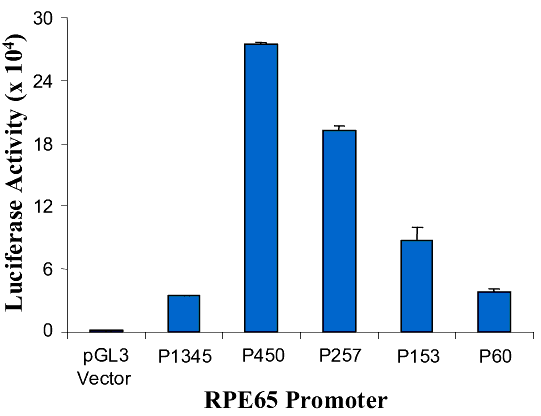
Figure 7. Effect of retinoic acid on RPE65 promoters
A: Diagram of the RPE65 promoter luciferase reporter gene constructs (lines, upstream region of RPE65; yellow boxes, +39 bp of the 5' untranslated region; arrow, direction of transcription; green boxes, luciferase reporter gene). B: RPE65 responsive luciferase gene activity of the pGL3-basic vector, RPE65 promoter and the promoter deletion mutants of AP1-del, AP4-A, NF1-del and AP4-B. The bars represent luciferase activity. C: Effect of RA on the activity of RPE65 promoter deletion mutants of AP1-del, AP4-A, NF1-del and AP4-B. Data are plotted as percent luciferase activity generated by the promoter with RA relative to that of each promoter without RA. Asterisks ("*") indicate statistically significant (p<0.05) decrease in the effect of RA on the mutant relative to the RA effect on P1345. D: Promoter activity of pGL3-basic vector, RPE65 promoter and promoter truncation mutants. The P60, P153, P257, P450 and P1345 promoters are diagrammed in A. The bars represent luciferase activity, the activity dramatically increasing at the truncation at P450, with this effect being lessened as the promoter truncation increases (activity of P450 >P257>P153 >P60). E: Effect of RA on the activity of RPE65 promoter truncation mutants. Data are plotted as percentage luciferase activity generated by the promoter with RA relative to that of each promoter without RA. Asterisks ("*") indicate statistical significance (*p<0.05) when the activity of the promoter with RA is compared to that of P1345 with RA. Data are plotted as means; error bars represent the standard errors of the mean (n=3).
A:
B:
C:
D:
E:
