![]() Figure 2 of
Chen, Mol Vis 2003;
9:345-354.
Figure 2 of
Chen, Mol Vis 2003;
9:345-354.
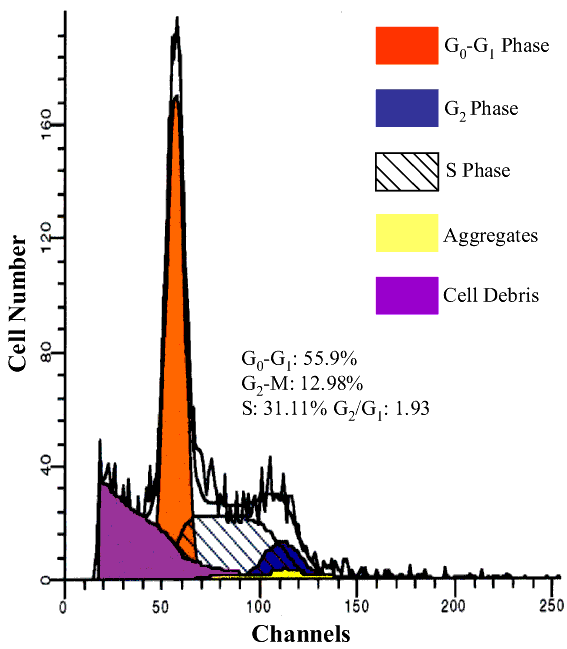
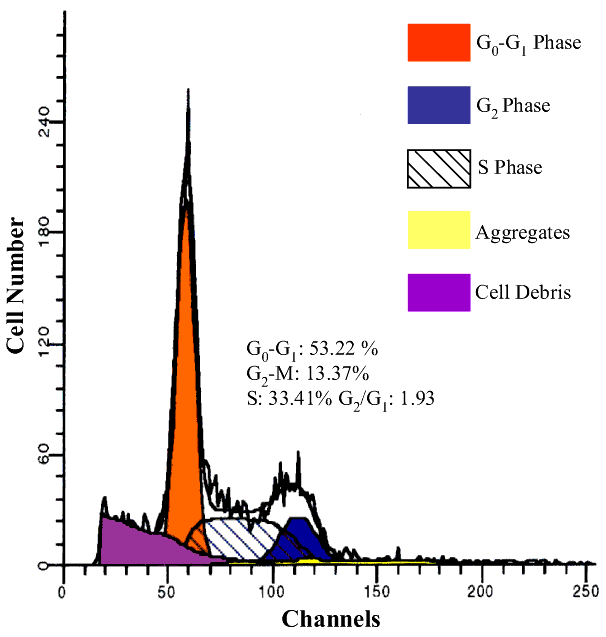
Figure 2. Flow cytometry cell cycle analysis
Cell cycle was measured as described in Methods, and data were analyzed by ModFit LTTM software. A: Control cells with vehicle added to the culture medium. B: Cells with 10-6 M RA added to the culture medium. No significant change in the cell cycle was observed.
A:

B:
