![]() Figure 3 of
Banh, Mol Vis 2003;
9:323-328.
Figure 3 of
Banh, Mol Vis 2003;
9:323-328.
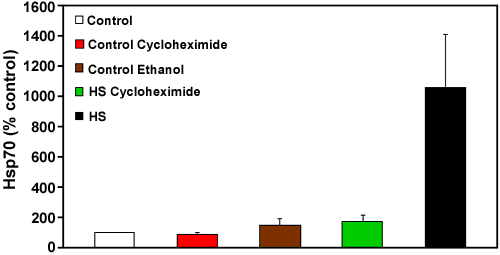
Figure 3. Hsp70 in 2 year old bovine lenses
The top panel shows a representative western blot using rabbit anti-Hsp70 polyclonal antibody. Heat shock cycloheximide (lane 4) and the control groups (culture medium, lane 1; cycloheximide, lane 2; and ethanol, lane 3) demonstrate no Hsp70 band. There was an obvious Hsp70 band for the heat shock group (lane 5). The bar graph (bottom panel) represents the density of the bands expressed as percent of control with culture medium. Values and bars represent the mean and standard error of the mean, respectively; n=10 for heat shock group, and n=4 for all other treatment groups. The heat shock (HS) group has significantly greater amounts of Hsp70 then all other treatment groups. Heat shock cycloheximide, control, control cyloheximide, and control ethanol were not significantly different (unpaired Student's t-test; p>0.05).
