![]() Figure 2 of
Wentz-Hunter, Mol Vis 2003;
9:308-314.
Figure 2 of
Wentz-Hunter, Mol Vis 2003;
9:308-314.
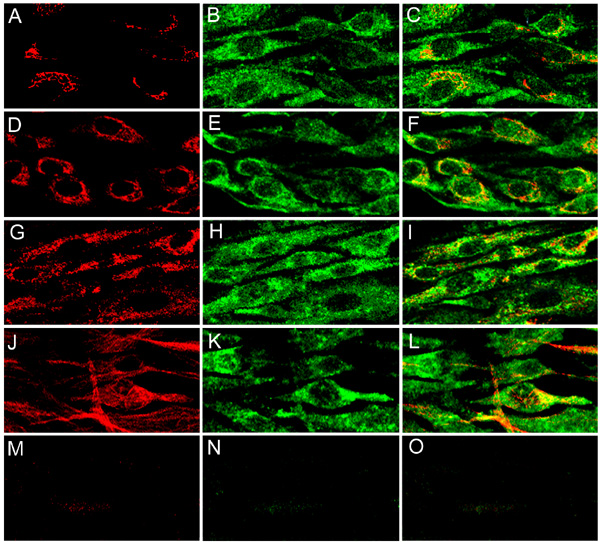
Figure 2. Double fluorescence staining in untreated control corneal fibroblasts
Micrographs show the staining patterns for Golgi complex (A), myocilin (B, E, H, and K), myocilin with Golgi (C), ER (D), ER with myocilin (F), mitochondria (G), myocilin with mitochondria (I), b-tubulin (J), and myocilin with b-tubulin (L). Negative controls using normal mouse IgG (M), normal rabbit IgG (N), and a combination of both (O) are shown. The staining was visualized using the Leica TCS SP2 confocal microscope. Bleeding through of the signals was corrected.