![]() Figure 7 of
Tasheva, Mol Vis 2003;
9:277-287.
Figure 7 of
Tasheva, Mol Vis 2003;
9:277-287.
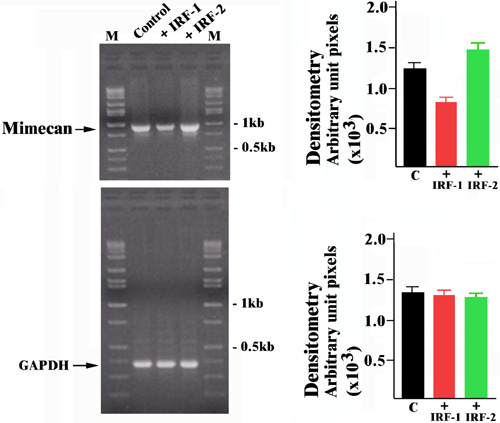
Figure 7. Introduction of IRF-1 reduces the expression of endogenous mimecan whereas IRF-2 has the opposite effect
Left: Total RNA was isolated from cells transiently transfected with IRF-1 or IRF-2 48 h after transfection. RNAs were subjected to RT-PCR with mimecan-specific primers. GAPDH was used as a control. The PCR products were resolved on agarose gels and visualized by ethidium bromide staining. Right: Quantitation of mimecan and GAPHD mRNA pools by scanning densitometry. The results are presented as the means with standard error bars (n=3).