![]() Figure 3 of
Tasheva, Mol Vis 2003;
9:277-287.
Figure 3 of
Tasheva, Mol Vis 2003;
9:277-287.
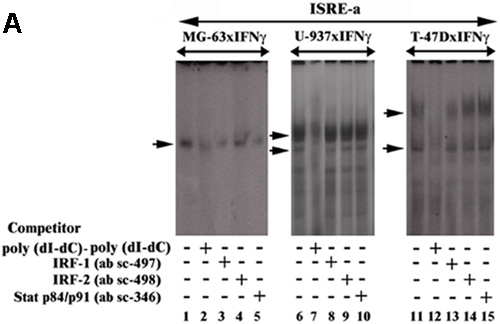
Figure 3. EMSA analyses using labeled ISRE oligonucleotides and nuclear extracts from
A: EMSA analyses using labeled ISRE-a oligonucleotide and nuclear extracts from MG-63, U-937 and T-47D cells treated with IFN-γ for 2 h. Arrows indicate DNA-protein complexes formed with the probe; B: Top: EMSA analyses using labeled ISRE-b oligonucleotide and nuclear extracts from MG-63, U-937 and T-47D treated with IFN-γ for 2 h. Arrows indicate specific DNA-protein complexes formed with the probe. Red arrow indicates the complex that contains IRF-1 and green arrow indicates the position of supershifted complex; B: Bottom: EMSA using labeled ISRE-c and nuclear extracts from untreated and IFN-γ-treated U-937 and T-47D cells. Arrows indicate specific DNA-protein complexes formed with the probe. Red arrow indicates the complex that contains IRF-1 and green arrow indicates the position of supershifted complex.