![]() Figure 2 of
Tasheva, Mol Vis 2003;
9:277-287.
Figure 2 of
Tasheva, Mol Vis 2003;
9:277-287.
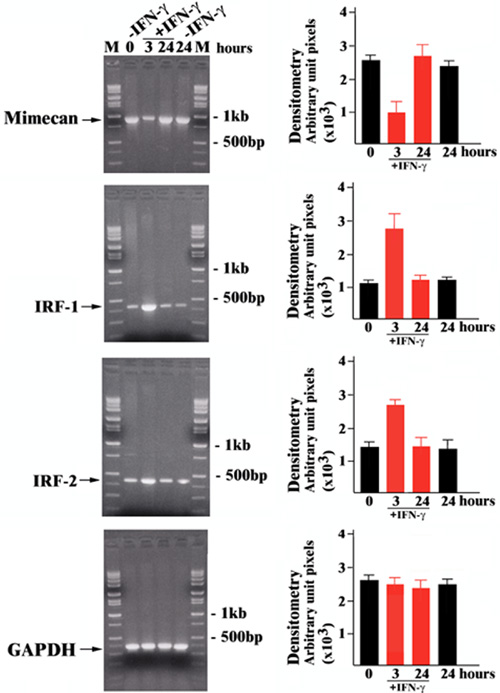
Figure 2. IFN-γ suppresses mimecan mRNA expression
A: Left: Semi-quantitative RT-PCR using primers for bovine mimecan, IRF-1, IRF-2 and GAPHD; Right: Quantitation of mimecan, IRF-1, IRF-2 and GAPHD mRNA pools by scanning densitometry. Data are presented as means with standard error bars (n=3); B: Expression of endogenous mimecan, IRF-1, IRF-2 and GAPHD mRNAs in three cell lines before and after treatment with IFN-γ. Left: Semi-quantitative RT-PCR; Right: Quantitation of mimecan, IRF-1, IRF-2 and GAPHD mRNA pools by scanning densitometry. Data are presented as means with standard error bars (n=3).
A:
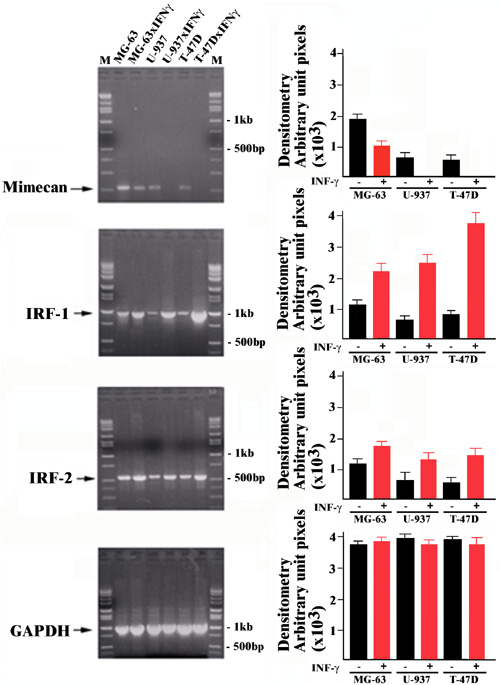
B: